Best US Stock ETFs for Canadian Investors Funds from Vanguard and iShares dominate our list of the best ETFs for investing in US stocks. Gabe Alpert
For This Vanguard ETF, the Concentrated Canadian Stock Market Constrains an Otherwise Sound Process Zachary Evens
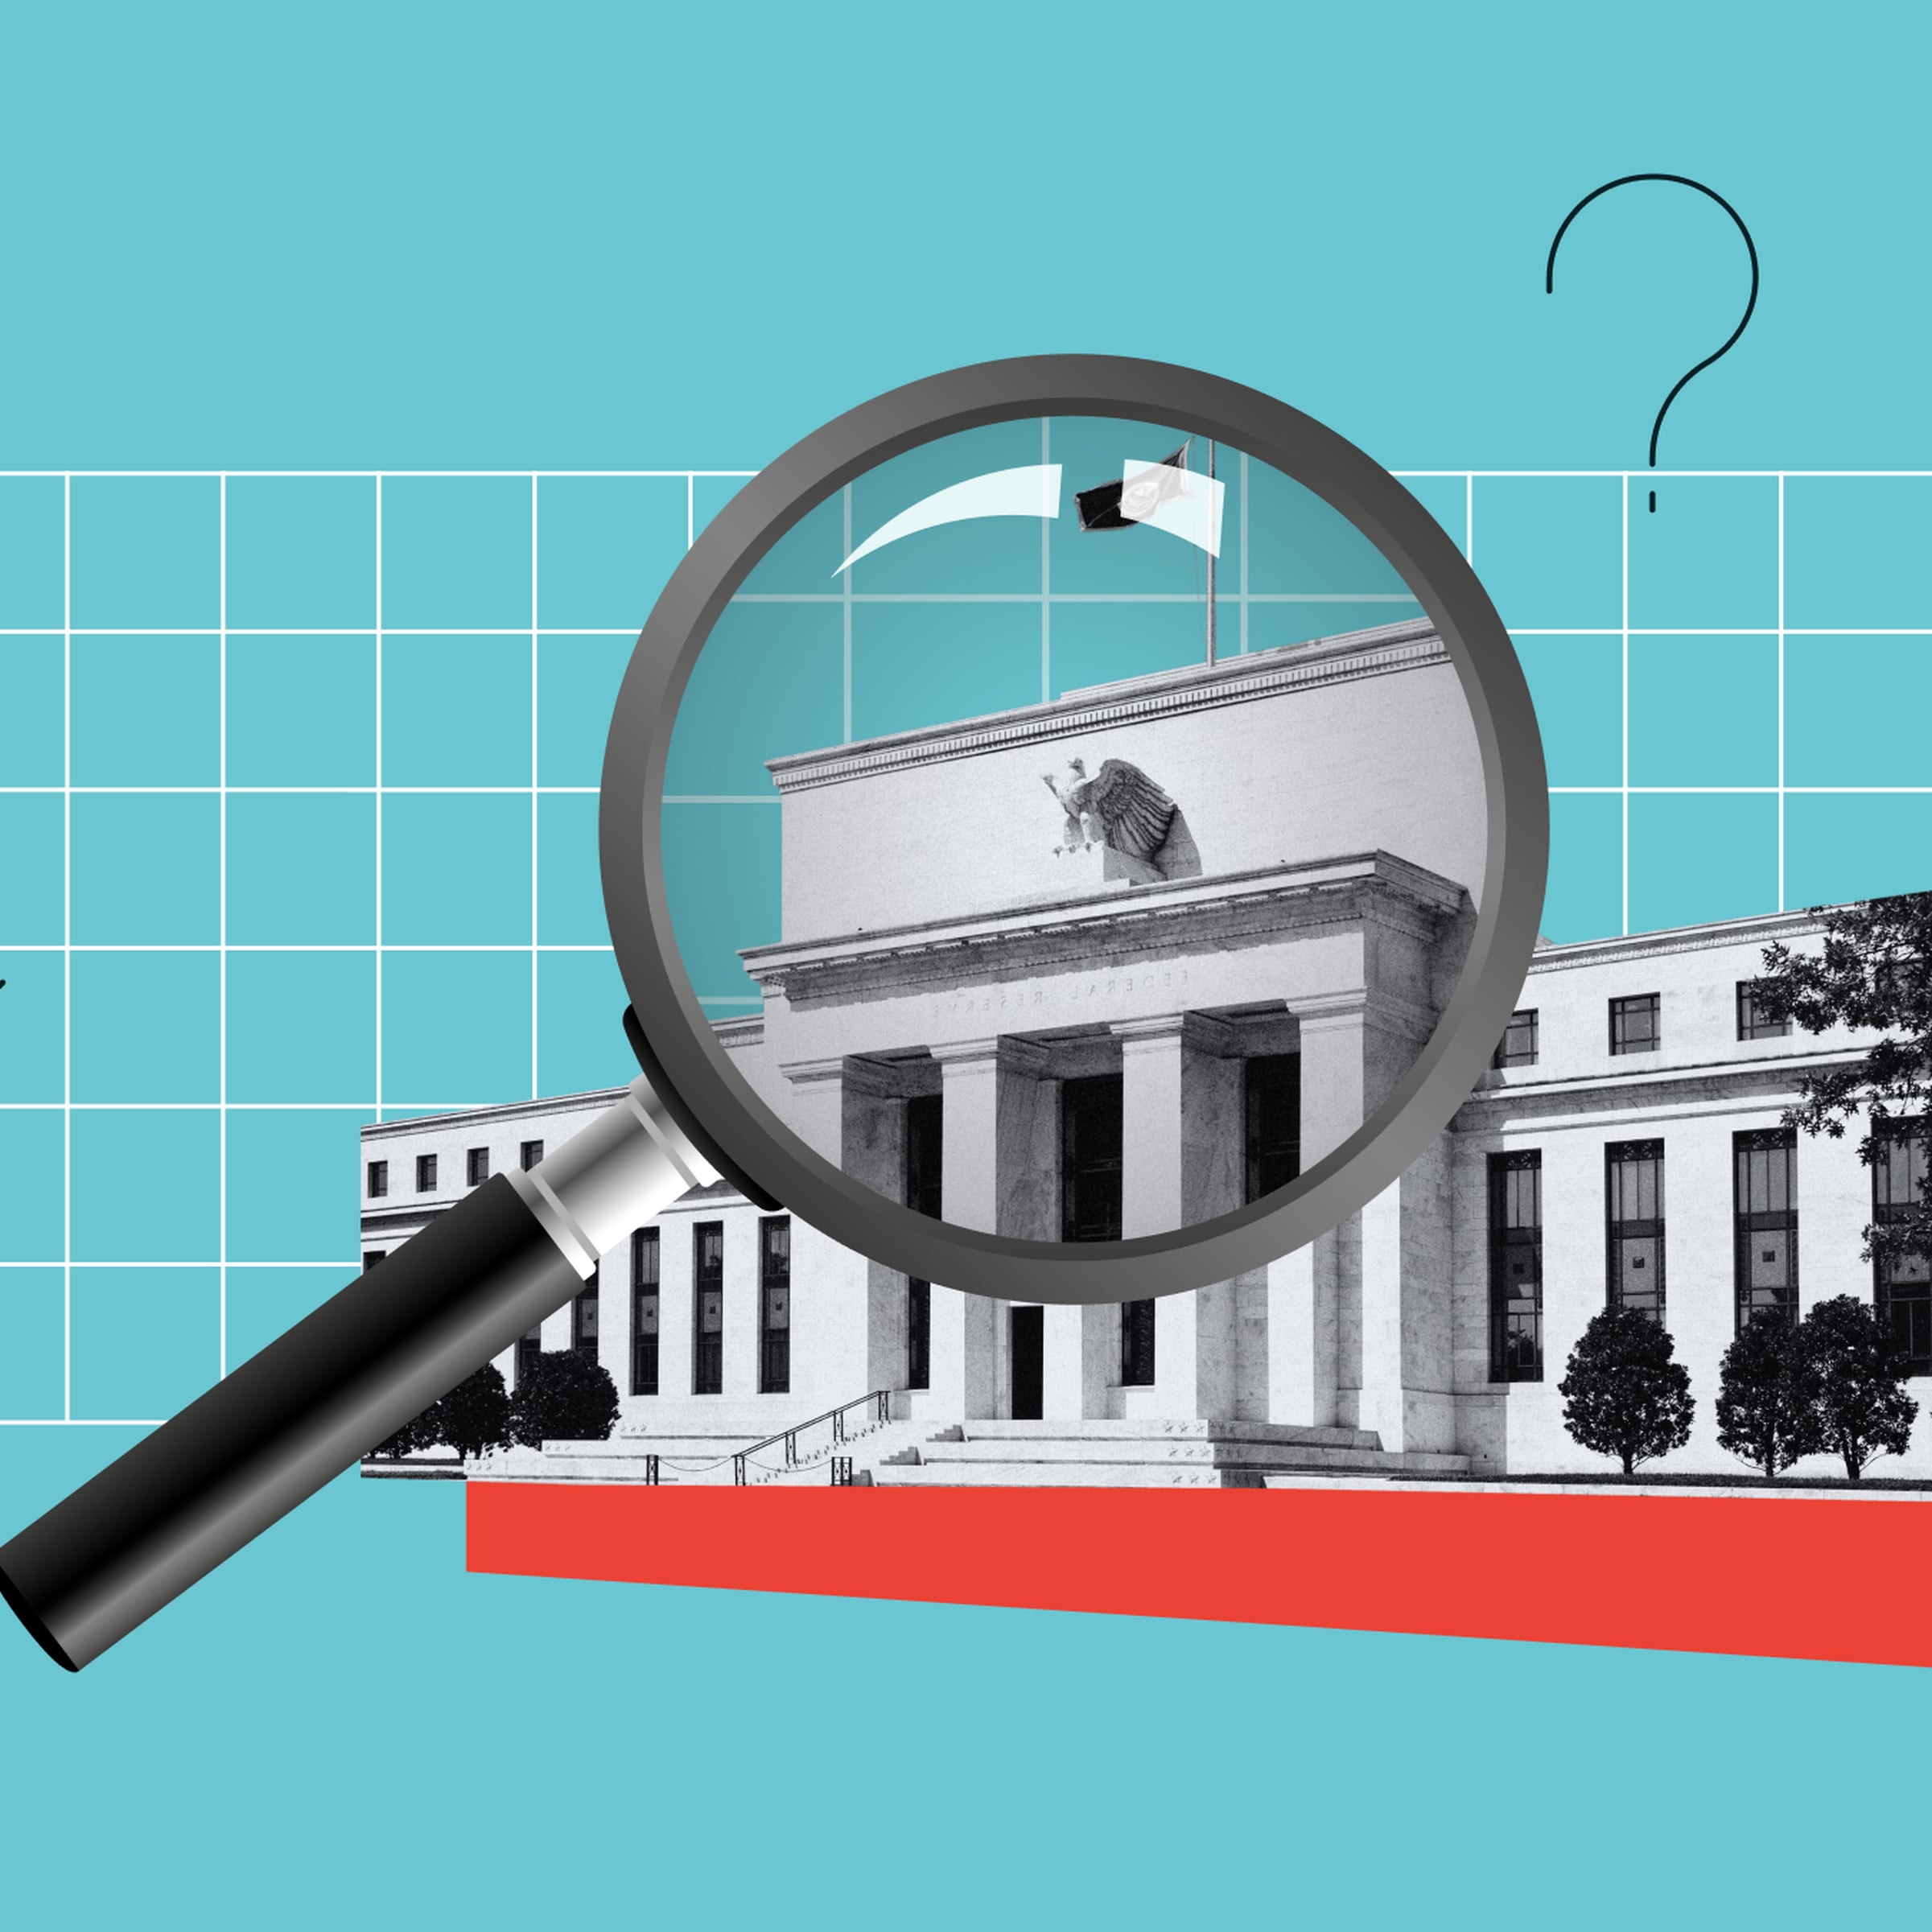
BlackRock’s Wei Li: Despite Long-Term Uncertainties, the Near Term Looks Solid for US Stocks Sarah Hansen
Barrick Earnings: Solid, As Higher Gold Price More than Offsets Lower Volumes, Increased Unit Costs Jon Mills, CFA
Constellation Software Earnings: Organic Growth Drives Solid Quarter Despite Lower Acquired Revenue Alex Medow
Canadian Tire Earnings: Strong Sales Growth, but Higher Investment Unlikely to Yield Long-Term Gains Kristoffer Inton
Nutrien Earnings: Shares Fall on Higher Unit Costs and Potash Price Concerns; We Disagree Seth Goldstein, CFA
BCE Earnings: Fiber Investment Continues to Drive Internet Revenue While Wireless Lags Samuel Siampaus
IGM Financial Earnings: Solid Results from IG Wealth Management and Mackenzie Investments Greggory Warren, CFA
Novo Nordisk Earnings: CVS Deal, Oral Semaglutide Support Growth Despite Compounding Uncertainty Karen Andersen, CFA
Great-West Earnings: Good Wealth and Group Benefits Results, but Empower Has Large Outflows Maoyuan Chen
Berkshire Hathaway Buys UnitedHealth and Reveals Mystery Stocks Berkshire has been quietly buying D.R. Horton, Lennar, and Nucor. Greggory Warren, CFA
With this Fidelity Fund, a Steady Hand Tempers Volatility Fidelity True North is an ideal pick for lower-risk exposure to a broad range of Canadian equities. Luke Richardson
Shock July Jobs Data Boosts Odds of a Bank of Canada Rate Cut in September June momentum fails to keep going as Canada sheds 41,000 jobs in July, raising the possibility of a rate cut as early as next month. Vikram Barhat
BlackRock’s Wei Li: Despite Long-Term Uncertainties, the Near Term Looks Solid for US Stocks The AI boom and deregulation may offer stronger opportunities than macro bets. Sarah Hansen
For This Vanguard ETF, the Concentrated Canadian Stock Market Constrains an Otherwise Sound Process Zachary Evens
The Deficit is the Biggest Risk for the US Bond Market, Says Matt Eagan of Loomis Sayles Leslie P. Norton
BlackRock’s Wei Li: Despite Long-Term Uncertainties, the Near Term Looks Solid for US Stocks Sarah Hansen