


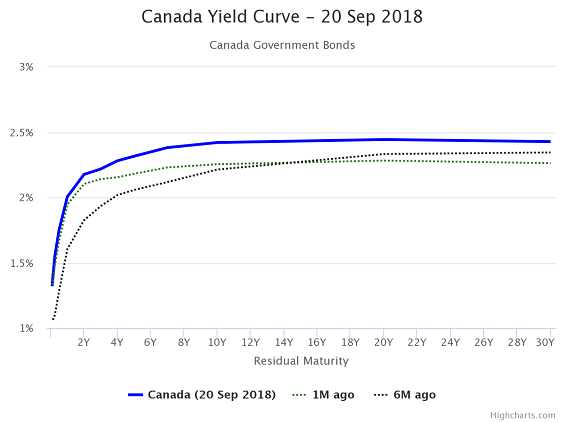
The yield curve started 2018 sort of flat. And, as you can see from the chart below, Canadian short-term yields have risen from where they were six months ago, but long-term yields continue to be sluggish. Should we be concerned about this?
- source: www.worldgovernmentbonds.com
In a "normal" yield curve, short-term yields are lower than long-term yields, because you would expect to be compensated for taking on more risk in the form of longer bond maturity.
When the yield curve flattens, the spread between shorter-term bonds and bonds of longer maturities shrinks. This is often measured as the spread or difference between the yield on the 10-year government bond and the 2-year bond. At the start of 2017, the spread was 0.97, and as of Friday it was 0.24. A similar move can be seen in U.S. interest rates as well.
A closer look at what's going on
It's not so difficult to understand what's going on at the short end of the curve: This is the part over which central banks exercise more direct control. We started the year with the Bank of Canada's benchmark rate at 1%. The central bank has raised rates twice so far in 2018--once in January (to 1.25%) and once in July (to 1.50%).
What's going on at the long end of the curve gets complicated, though. This is the part of the yield curve that is more influenced by investors' expectations, including market sentiment and inflation expectations. Though the S&P/TSX Composite Index is up slightly for the year, it's been a bumpy ride, with four out of eight months in the red.
And while inflation has crept up since last year, it is still well within the Bank of Canada's safe zone and is expected to decrease slightly over the next four years.
Also, importantly, even though the yields on government bonds might look anemic to a Canadian investor, low interest rates on global developed debt is helping to anchor the long end of the curve.
A flattening curve is hard to read
Many market-watchers interpret the flattening yield curve as a signal that winter is coming for this bull market. In actuality, though, it's closer to the truth to say that a flattening yield curve indicates that many investors believe that we're headed toward recession.
But, maybe the net result of those statements is the same anyway. A flatter yield curve can hurt lenders' profits and stability and their willingness to lend. If long-term and short-term rates are close, markets must be expecting little growth or lenders would demand a bigger time premium. This, in turn, (theoretically) slows down the business cycle.
Yield curves sometimes flatten on the way to inversions, which tend to precede recessions. The graphic below from the U.S. Federal Reserve shows the spread between the 10-year and 2-year U.S. Treasuries--the peaks are periods when the yield curve was steepest, while the dips below the zero line indicate that the yield curve was inverted. The shaded vertical lines represent recessions. (To see a larger version of the image below, click here.)

- source: St. Louis Fed
But as you can see from the chart, the yield curve can flatten for years without tipping into inversion. Further, comparisons to past cycles may not be all that relevant: The current environment is unique in the wake of the historic zero interest-rate policy.
Central banks should proceed with caution
Both the Bank of Canada and the U.S. Federal Reserve have been good about widely telegraphing their moves and not surprising the market. Surprises are best avoided, as evidenced by 2013's surge in U.S. Treasury yields in response to then-Fed chairman Ben Bernanke's statement that the Fed would begin tapering the pace of its bond purchases later that year, conditional on continuing good economic news.
That said, the U.S. central bank does seem to be moving toward a more hawkish stance. The Fed "dot plots," seen here on Page 3, show the expectations that each member of the FMOC has for the target fed funds rate through the end of the year and over the next several years. It can give a sense of how many rate hikes might be in the offing. In the most recent release, the dot plots show the median member anticipating a range of 2.25% to 2.5% by the end of the year, implying two more quarter-point rate hikes in 2018. (In the March release, the dot plots indicated only one.) 2019 could bring three more quarter-point increases, which would bring us to the Fed's long-term 3% target.
Even if the flattening yield curve on its own doesn't herald imminent danger, it's an indication that uncertainty abounds. Hopefully, near-term monetary policy decisions will calm the uncertainty and not exacerbate it.


