


World equity markets were basically unchanged on the week, as stocks were stuck in a tug-of-war between better economic news and fears that the U.S. Federal Reserve would push interest rates higher, perhaps as early as June.
Several notably better earnings reports ( Wal-Mart WMT and Home Depot HD) helped to limit the impact of new Fed worries. Equity markets varied from down 0.3% (emerging markets) to a positive 0.9% (Europe), with the U.S. in the middle of the range.
Most of the weakness this week occurred around the time of the release of the Federal Reserve minutes on Wednesday. Those minutes revealed the Fed was worried that world markets were not taking the possibility of Fed rate hikes seriously enough. Some of the more hawkish Fed governors (those worried about inflation and pushing for higher rates) got more air time earlier in the week, also spooking bond investors. The yield on the 10-year bond jumped from 1.72% last week to 1.85% this week, one of largest one-week jumps of the year. Still, that 1.85% rate is lower than before the Fed's March meeting and the 1.92% rate at year-end. Broad U.S. bond indexes lost just 0.5% for the week, with high-yield bonds faring better with small gains. Bond prices remain close to 2016 highs, despite greater caution this week.
Commodity prices were up about 1% on stronger economic news and supply, demand and inventory issues. Commodity prices have soared 14% since their February lows. Year to date, commodity indexes are the big winners, up nearly 10% even as equities have basically gone nowhere.
The Fed fixation continued. We have gone through a Fed dance every few months in a cycle we seem doomed to repeat. The dance steps include an economy that apparently is gaining momentum, Fed governors openly worrying about the stronger economy and musing on higher rates, followed by a softer stock market and weaker economic data. Then the Fed backs away from threatened rate increases, markets rise, and the economy acts better. Repeat every three to six months.
This has been ongoing since late 2014, maybe earlier if you count the worries over when the Fed would stop buying new bonds under one of its quantitative easing programs. At the moment, the U.S. economy has undergone the stronger-economy and whispering-about-a-rate-hike step of the dance. We think that the strong-growth step may not last as long as usual. We suspect the brick-and-mortar retailer slump and a clear peaking in the auto industry could hit some key economic indicators before the Fed's June meeting.
The U.S. economic data for the week was consistently strong with better housing data, industrial production figures and a larger-than-expected increase in consumer prices. Combined with last week's retail sales report, the U.S. economy has apparently made an amazing deathbed recovery from yet another winter sinking spell. The economy's apparent rise from the dead generated fears of a potential Fed rate increase and a sharply accelerating economy.
Do not be fooled by that narrative. Weather and seasonal factors, whose influences are more apparent in a low-growth environment, have produced three terrible first GDP quarters in a row. The economy was neither nearly as weak as appeared this winter, nor as strong as it appears now. In our opinion, the economy will struggle mightily to stay in its 2.0%-2.5% GDP growth channel, as energy prices move higher, the workforce ages, and population growth sinks.
Central banks will be relatively helpless in reversing this demographic reality. We continue to believe that investors' focus on central bank actions remains misplaced. Some of that time would be better spent focusing on the economy's demographic winners and losers. Alternatively, following up on the shift in retailing away from expensive brand names, imported goods and online retailing might yield more investor profits. Still, relatively high valuations, a likely continuing profit squeeze due to higher wages, and a limited ability to raise prices will provide a powerful headwind for corporations and world equity markets in the months ahead.
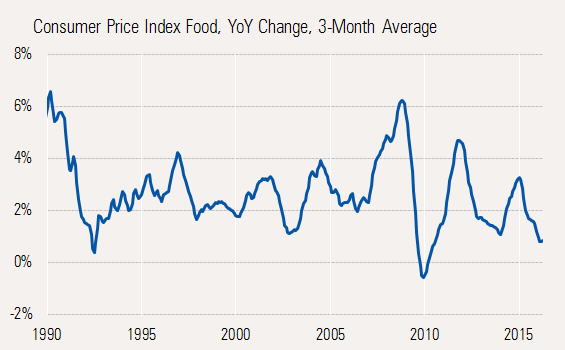
Food prices help push out inflation day of reckoning
Headline inflation shocked some this week as month-to-month inflation jumped to 0.4%, driven largely by higher energy prices. Core inflation, excluding food and energy, was up 0.2%, which still annualizes to over 2% annual inflation. Year-over-year total inflation for April was just 1.1%, still benefiting from lower energy prices. That year-over-year figure has bounced around between 1.1% and 1.3% since the January spike. Core inflation (excluding food and energy) is running at 2.2% year over year, very near the recovery high.

Source: Bureau of Labor Statistics
With energy tailwinds continuing for a few more months and modest food inflation, the total CPI number may not get a lot worse until August, which is when gasoline prices started to fall apart a year ago. We still expect headline inflation to be well over 2% by December. We are a little less sure if the jump will come soon enough to trigger a significant increase in Social Security payments for 2017. That determination is made from third-quarter year-over-year inflation rates.
The data by key sector and in total, on a three-month moving average, is shown below.

At the moment it is primarily the nonenergy-related services portion of the calculation that looks problematic, with annual inflation of 3%. The good news there is that services inflation hasn't gotten any worse since January. However, deflation in nonenergy goods (related to a strong dollar) and energy has masked the relative high services inflation rate. Strong help from the energy sector will likely disappear by December, and the weaker dollar, after a very strong run, is likely to diminish goods deflation by year-end, too. Food has surprised us on the downside as the diminution of U.S. droughts a couple of years ago has finally worked its way through the food chains, with even normally lagging beef prices joining in the price declines.
Source: Bureau of Labor Statistics
However, a summer of bad weather could wipe out those gains in a hurry. The food category also includes restaurants, which will likely accelerate price hikes to compensate for higher wages (driven by both supply and demand of workers, as well as minimum wage increases).
Housing market shift to new single-family construction continues
Housing remains a key driver of the U.S. recovery, second only to consumer spending, despite its relatively tiny size relative to GDP (3%). That percentage continues to creep up, though the driving force continues to shift among existing homes, remodeling, new apartments and new single-family homes. Existing-home sales, though satisfactorily improved in April (discussed below), have stalled out. New home activity has been improving, though it appears in this month's report from the U.S. Census Bureau that interest is shifting to single-family homes. The permit data (which usually turns up eventually as a start and in the construction reports) for multifamily homes has slowed sharply in recent months while single-family permits continue to plod ahead.
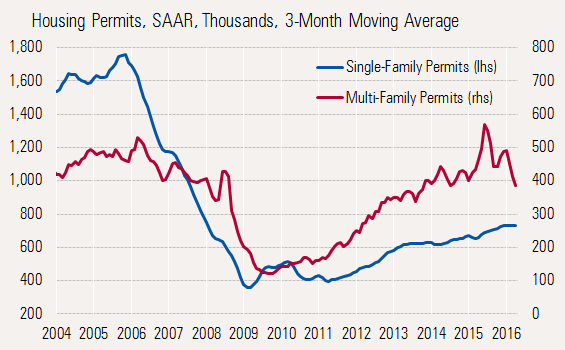
Source: Census Bureau
We suppose that plodding single-family permit growth is only relative to the once-booming multifamily sector. Single-family permit growth has been in the 10%-12% range. Given the far bigger impact of single-family home construction compared with apartments, and the bigger size of the category, strength of the single-family market is critical to our economic outlook.
Demographics would seem to favour ongoing improvement in the single-family market. The data shows clear improvement, though we caution that starts data is much less reliable than permits data and weather adds some volatility, so we would not pay too much attention to the starts data, other than to say it is not sustainable. With permits required for most homes, the starts data is likely to crash back to earth. Don't worry, it's just a statistical artifact.

Existing-home sales improve month to month, best growth behind us
News commentators seemed quite excited by the monthly pickup in existing-home sales. Sales grew 1.7% month to month to 5.45 million units, ahead of the most recent 5.40 million consensus forecast. On a year-over-year basis, sales were up 6%, still ahead of National Association of Realtors forecast of 3% growth for the full year. So far in 2016, sales appear to be running very close to the 6% growth rate of 2015. Average year-over-year price growth of 3.5% trails weighted prices index increases of closer to 6%, indicating greater activity in low-priced homes than high-priced homes. There is anecdotal evidence that the stock market softness has reduced activity in the higher price tiers. Three-month averaged data, shown below, demonstrates similar trends.

Taking the long view, higher prices and lower inventories have slowed existing-home sales. New homes have also added competition from new construction. In addition, the cost and disruption of moving have caused many homeowners to remodel instead of trading up. Growth in the remodeling area has accelerated dramatically and provided a bigger boost to economic growth than single- or multifamily construction in the most recent quarter. Strong recent results from Home Depot and Lowe's LOW suggest the remodeling trend has some legs.
While recent data has excited some, the existing-home market sales growth hasn't really gone anywhere since last year. With higher interest rates as another potential hurdle in addition to inventories and high prices, it's not surprising that the Realtors aren't very excited by the prospects for the rest of 2016.

Source: National Association of Realtors
Headline industrial production spikes in April, manufacturing-only better, too
Headline industrial production jumped by 0.7% between March and April, driven mainly by improved utility production as weather returned to more normal conditions in April. Poor utility sales in a February and March contributed to two back-to-back declines in industrial production. However, it wasn't all about utilities, either, as the manufacturing-only component managed a 0.3% increase, also snapping a two-month losing streak.
Unfortunately, the mining sector stretched its monthly losing streak to seven months as oil production slumps. About the only good news on the mining side was that April's 2.3% decline was considerably smaller than the 3.0% loss in March. From its peak in December 2014, mining output has fallen about 18%. Half of the mining production loss has occurred since November 2015.

In our past analyses, we generally have given short shrift to the mining and utilities parts of the industrial production report. Our logic was that the energy patch problems were well-known and that utilities were entirely a function of weather, and didn't really tell us much about the state of the economy. However, mining and production have and continue to weigh on the GDP calculation, both directly and indirectly. Machinery--for producing and moving oil--flows through manufacturing accounts, and business investment in equipment and physical oil wells themselves flows through the structures portion of business investment. That is just the direct impact. Things like tubular steel, specialized computers, quarried sand and even the rail car building industries are all affected. As a lot of mining-related activity is built slowly, over five or six years, the positive impacts on the economy weren't totally recognized. Now, the rather hasty decline in the mining sector is beginning to have a more noticeable impact.
On the utilities side, warm weather has meant less utility usage, which shows up as lower consumption. Gas and electric utilities really hurt consumption in the fourth quarter, with an especially warm December. Then a return to normal weather meant a higher contribution in the first quarter. Now April utility data from the industrial production report suggest the second quarter is off to a good start for utilities.
Turning to our normal manufacturing analysis, month-to-month manufacturing production for April showed a 0.3% increase following two monthly declines. The breadth was good, too, with eight of the 10 largest categories showing improvements in April. Year-over-year growth was a seemingly uninspiring 0.6% (0.6% on a three-month averaged basis, too), though the trend is up, as January showed no growth at all.

The longer-term picture looks a bit bleaker than we hoped after a large data revision a month ago. Some of the great manufacturing data that we had seen now looks more like a typical recovery bounce between 2010 and early 2013 followed by sluggish results. With sectors such as autos and aerospace softening, the short-term prognosis for a swift improvement is not good.

Source: Federal Reserve
One silver lining is that the worst of the year-over-year declines are concentrated in the machinery, fabricated metals and aerospace and defense categories. Some of the other categories aren't as strong as they once were but are still in positive territory. That combination is likely to keep the manufacturing sector from being much help in 2016, though the entire sector is not in a free-fall as some would suggest.

Another GDP revision, manufacturing data and trade all next week
While there are a lot of economic releases next week, we don't expect any of them to be particularly market moving, with the possible exception of the Markit flash manufacturing data for May. The Markit U.S. readings won't do much for markets. However, data out of Europe and Japan can be influential as the manufacturing sectors in these countries are of greater economic importance than in the United States. Europe seems to be particularly worried at the moment, despite some decent first-quarter growth rates. This report could either amplify or assuage those fears.
The permits and existing-home data this week gave us a respectable image of the housing industry. The new homes report will shed light on buyer interest in homes that are still on the drawing board. Those sales could extend the housing rally and benefit future quarters. New home sales for April are expected to move up modestly from 511,000 units to 525,000 annualized units, though this metric can be volatile and subject to large revisions. The pending-home sales report should help in determining if this week's better-than-expected existing-home sales data was a fluke or if recent good news can be prolonged. The index is expected to be up 1%, according to the current consensus.
The trade deficit in "goods only" is expected to widen from US$57 billion to US$59 billion in April as unusually weak imports for March are forecast to bounce back in April. Lack of matching inflation data and potential stops and starts in oil deliveries from the Canadian oil sands may muddle the report. We will watch the imports of consumer goods particularly closely. With so many retailers reporting weakness, imports could feel the heat again in April, though the recent retailer reports could explain why imports were already down significantly in March. We are at least a little afraid that poor U.S. apparel sales and other retail categories may take a least a small bite out of world growth, in regions of the world that can little stand more pressures.
In the U.S., durable goods orders are expected on Thursday. With some luck they may help determine if the recent improvement in industrial production can be extended. Though, the first month of a new quarter is normally soft, and not as indicative of future results as data from other months. Orders are expected to be up a healthy 0.3%, following an unusually good report of 0.8% growth in March. Transportation orders tend to foul up the interpretation of this report, which usually has little market impact. Guessing GDP revisions can be a really dangerous sport. Next week's first-quarter GDP is no exception, with economists anticipating a healthy upward revision, based on recently released data revisions. Those reports, including retail sales, suggest an upward adjustment to the first-quarter GDP growth rate from 0.5% to 0.9%, according to consensus forecasts. However, these obvious categories often result in subtle and offsetting changes, in other categories such as imports and inventories, which are harder to pin down. So the optimistic projections aren’t necessarily a sure thing.


