Most worldwide equity markets showed modest gains this week, generally ranging from 0.3% to 2.4%, with the broad developed-market indexes doing the worst and emerging-markets doing the best. A much softer tone from two U.S. Federal Reserve speakers this week, including Chair Janet Yellen, eased any remaining fears of the Fed raising rates in April. This was in contrast to a more hawkish set of speakers last week, who caused the market to break its five-week winning streak.
A weak consumption report for February and huge downward revisions to the January consumption growth rates indicate that some of this week's caution may have been warranted. Soft auto data at the end of the week indicated that consumption growth may not accelerate in March. This generally weaker view helped depress commodities, which fell about 2% for the week and dropped the rate on the U.S. 10-year Treasuries to 1.79%, down from 1.9% the prior week.
The two other big pieces of data this week were the U.S. employment report, which was slightly better than expected, and purchasing data from around the world that came in better than hoped, with forward-looking data on new orders driving the composite index sharply higher, especially in the United States. Even the heretofore poor Chinese data turned in its best performance of the past year. Unfortunately, even as the composite indexes looked great, employment indexes continued to recede in almost every market, despite the improvements. We also caution that the employment report identified some new risks to wage growth--namely, shrinking work weeks and lacklustre hourly wage rate growth in the face of higher inflation. Nothing here was disastrous, but there certainly are indicators that wage growth could slow for all of 2016, especially on an inflation-adjusted basis. That will in turn lower the consumption outlook for the year, but especially in the first quarter. So a lot of economists spent the week marking down first-quarter GDP forecasts to 1.5% or so. The GDPNow forecast from the Atlanta Fed produced an even lower forecast (an overly pessimistic one, in our minds) at just 0.7% GDP growth.
Decent employment report glosses over potentially slower income growth issues
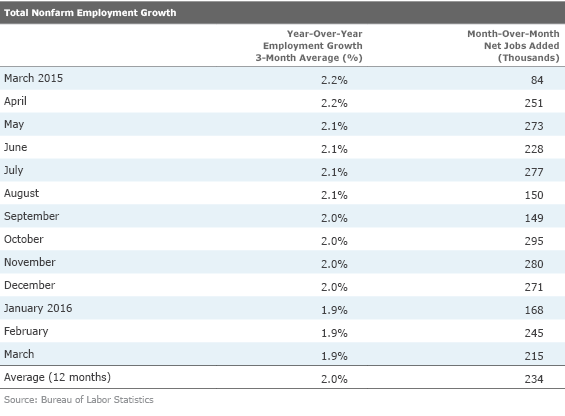
Headline employment growth for March remained on its long-term trajectory at 215,000 total jobs, representing 2.0% year-over-year employment growth, consistent to slightly higher than what projected year-over-year first-quarter GDP growth (about 2.3%) might suggest.
There was a lot to like in the report. The job gains were broad-based in the services sector, hourly wages were up, the participation rate increased yet again, and there were almost zero revisions to past data. Despite this good news, some of the underlying data points (especially hours worked and inflation) suggest that total inflation-adjusted wage growth has slowed meaningfully over the past year, potentially limiting consumption growth, the key driver of U.S. growth. More on those worries later.
First, let's discuss the headline employment data. The 215,000 jobs added in March compared favourably with the 12-month average of 220,000 and was a great showing after an unusually large gain of 242,000 jobs in February. The number looked particularly good in light of the fact that the manufacturing sector shed 29,000 jobs in March and mining shed 11,000 jobs. Both of these sectors have been slowing for some time, and it has been a bit surprising that manufacturing jobs didn't begin slowing sooner. Government, for a pleasant change, added 20,000 jobs. Healthcare and retail, two key growth sectors, continued to do better than recent averages. However, averaged year-over-year growth in nonfarm payrolls has deteriorated modestly from 2.2% last March to 1.9% this March, indicating at least some loss in momentum.
Hourly wage data a little better
Hourly wages jumped US$0.07 in March, more than offsetting the smaller than previously announced US$0.02 decline in February. The year-over-year data looks stronger than the sequential data, with a 2.3% single-month growth rate last month. That growth rate was about the same at 2.2%, though below the high-water growth rate of 2.6% reached this fall.
The wage performance has done better than one might expect given a lot of headwinds. High-wage, high-hours manufacturing and mining sectors are hurting, while some lower-wage sectors like retail and restaurants have been doing better. A rather dramatic slowing in temp employment growth is also weighing on the data as people moving from temp to full-time positions often accept a lower hourly wage for increased benefits. Finally, growth in healthcare sector wages has been below nationwide averages, perhaps as lower-wage workers and more doctors and nurses are driving employment growth here. A flood of new workers into the workforce may also be putting pressure on wage growth.
Hours worked continued to be a bit of disappointment. This data set seldom moves at all--and often moves in 0.1 hour increments--but dropped 0.2% in February to 34.4 hours. We had hoped that the February number would be revised higher and that maybe would grow a little bit in March, bringing us back to the 34.6-hour level that has typified the past year. Instead, hours were unchanged, standing at 34.4, the lowest level since early 2014. Unfortunately, some of the lower hours offset some of the otherwise healthy growth in employment. Looking back at the data, we are a bit surprised by the persistence in the hours-worked weakness, which now extends back to over five months, at least on a moving-average basis.
Rolling in employment growth, hourly wage growth and hours, total wage growth slowing

Total wage growth has slowed from 5.1% a year ago to 4.3% and is now below the 12-month average of 4.7% growth. It's certainly not a disaster, but it is not an insignificant slowdown in a world of low growth rates to begin with. And it may be part of the reason that consumption and retail sales growth have fallen a bit, too.
Adjusting the wage data for increasing inflation makes the income data look even worse
Last March, inflation was basically nonexistent, and we suspect the year-over-year, averaged total Consumer Price Index number for March could move as high as 1.1%. This compounds the effects of already slower nominal growth that was being hit by modestly slower employment growth and abnormally large effects from lower hours.

Wage growth of 3.2% looks paltry compared with the 5.2% level of a year ago and even the 4.2% average of the past 12 months. The good news is that the year-over-year inflation rate might stall out until June, though by the end of the year the impact could be painful, with headline inflation potentially accelerating to 2% by December. Hopefully, hourly wage rates will pick up a little steam, too, and the hours-worked data will return to more normal levels. Still, it is likely the total wage growth rate, adjusted for inflation, will continue to worsen in the back half of 2016.
Labour force participants and the participation rate show surprising improvement
One of the real bright spots of the report was a continuing increase in the size of the labour force. Since September, the labour force, both employed and unemployed, has grown by an astounding 2.4 million people. In the six months prior to September, the labour force did not grow at all, so this is a quite remarkable turn of events, showing greater confidence in the labour market.
It's also unexpected given some tremendous demographic headwinds (the baby boomer retirement rate accelerating). The widely watched participation rate increased from 62.4% in September to 63% in March. On a March-over-March basis the participation rate increased from a 62.5% rate to 62.8%.
This is mostly good news as we had feared that limited labour market growth could be holding back economic growth and detrimental to longer-term budget prospects. However, more new entrants did push the unemployment rate back up to 5% (from 4.9%) as labour pool growth exceeded job growth. As we mentioned above, that might be what is keeping a lid on wage growth, too--another dark side to the improving participation rate. Plus, those without a high school degree (45.2% to 46.4% year over year) are the primary drivers of the improving participation rate. High school and college grads improved just modestly. Surprisingly, those with an associate's degree or just some college saw a year-over-year decline in participation rates.
Income and consumption data slower than we would like
Some of the issues turned up in the March employment report were also present in the February Income and Consumption report that was released earlier in the week. Headline growth of 0.2% for income and 0.1% for consumption generally matched exceptions. A 0.1% decline in prices boosted these figures to a slightly more acceptable though still low 0.3% for income and 0.2% for consumption.
However, the bigger issue was a downward revision to February data that wiped all consumption growth in January, though income growth was still a healthy 0.3%. Consumption growth for January was previously reported as 0.4%, so this was a dramatic decrease that caused everyone to reduce the GDP and consumption growth outlook for the first quarter. First-quarter GDP growth is now expected to be just 1.5% or so versus over 2.0% just a couple of weeks ago. The GDPNow report from the Atlanta Fed is now down to just 0.7% for the first quarter. So, a poor consumption report this week and an upward revision to fourth-quarter GDP growth have combined to blow a hole in most forecasts.
We aren't quite as pessimistic--the actual level of GDP by the end of the first quarter may not be all that much different than previously believed. It's at least partially because the goalposts have been moved as the fourth-quarter starting point has been revised up from 1.0% to 1.4%. Remember, the original fourth-quarter estimate was for just 0.7% growth when it was released at the end of January. Therefore, we aren't losing too much sleep over what is likely to be a soft first-quarter GDP report.
Some reduction in the consumption report for January was expected because of revisions to the retail sales report announced in mid-March. Services looked surprisingly weak, mainly because of poor restaurant spending growth, but that was not as well-anticipated. The fall in restaurant sales may have been a function of poor weather, but we really can't be sure.

Perhaps slightly more worrisome than the month-to-month softness in consumption is an ongoing weakening in the year-over-year data for consumption and income. Since last spring, year-over-year growth income and consumption have been meaningful.

Data from this week's employment report suggest that income and inflation pressures are likely to increase in March, which will continue to put pressure on consumption. We had thought that last year's data was perhaps a tad overstated because of volatile inflation data. Nevertheless, it's very hard to argue that inflation-adjusted earnings and consumption for all of 2016 are likely to match the levels of 2015. With the exception of government spending and potential housing, it is not clear what will offset a modestly softer consumption category in the 2016 GDP calculation. There doesn't appear to be a disaster brewing here, but things in 2016 may not be as good as they were in 2015.
Auto sales come in short of expectations, further fuelling consumption worries
The March auto sales data came in too late for us to do much analysis, but the data was clearly disappointing at first glance. The seasonally adjusted annual sales rate was just 16.6 million units versus expectations of about 17.3 million units and last year's 17.1 million units. It was the first month below 17 million units since last April. There was at least some thought that the timing of the Easter holiday at the end of the month may have been part of the issue. And, of course, there is the ongoing issue of the selling days calculation. March sales looked OK--not great--before adjusting for the fact that there were two extra selling days this March compared with last March. We are not so sure that this archaic adjustment factor metric hasn't outlived its usefulness. If you skipped the days-sales adjustment, sales were up about 3% year over year, still not too exciting but not the disaster that some of the headline figures suggest. Sales of luxury brands were mostly down, and down more than other categories, suggesting that generally poor stock market performance may at last be weighing on that market. We suppose radically higher gas prices in March may not have helped matters.

The manufacturing sector catches a break at last
The purchasing manager data across the world and across survey companies did better than expected in March, driven by a combination of mostly better orders and current production levels. China, Europe and the U.S. all showed higher overall readings, and only the Caixin Index for China was below 50, the separation between growth and contraction. And even that index is extremely close to 50 after a pop from 48.0 to 49.7, the best reading of the past 12 months. Particularly important is the fact that the new orders component of these three markets is improving, and this is the most leading of all the individual components.
On the other hand, none of these readings shows anything like a new boom ahead. These numbers are still painfully close to 50. Furthermore, the employment gauges in all three regions are still headed down, indicating that employers aren't feeling terribly confident (or they have suddenly gotten serious about improving productivity in a low-growth environment.) Unfortunately, slow employment gains in the U.S. official employment report suggest that managers were not telling fibs when they filled out their PMI reports on employment prospects.

In the U.S. we prefer to use the longer track record data from the ISM to gauge the manufacturing sector, and the news here was even better than the Markit data. The U.S. ISM reading jumped from 49.5 to 51.8 in March, one of the biggest monthly moves we have seen in a very long time. Recent ISM improvements have been matched by advances in the industrial production statistics, as shown below.

The forward-looking new order component definitely had a too-good-to-be-true feel, moving from 51.5 to 58.3 in a single month. The improvement was broad-based, with certain sectors showing growth, two were no change, and just three showing decline. Like last month, the anecdotal comments were also shockingly positive and also very broad-based. Instead of reproducing those comments, here is the link to the report.
Still, the folks in human resources didn't seem to be big believers as the employment metric was down from 48.5 to 48.1, which makes not only moving down, but also contracting, at a faster pace. We are hoping this is just a delayed reaction to earlier reductions in production cuts and not the start of something worse.
Pending home sale data reassure us the existing-home market is doing OK
Existing-home sales data has been all over the place recently through a combination of delays due to new paperwork requirements to move from the under contract stage to a closed sale, shifting weather patterns and funky seasonal factors. The pending sales data, which is less influenced by these factors, provides a much more stable though slower-growing view of the world. Since September the difference between the best month and the worst month was just 4% for the pending home data set. Meanwhile, closing the difference between the best and worst months was a whopping 11%. So we would be very careful about drawing many conclusions from the existing-home sales data until the paperwork jam-up is cleared out of the system. Pending sales for February were up 3.5% month to month, providing an antidote to last week's seemingly scary 7% decline in existing-home sales. The pending home sales data is also running quite close to previous recovery high levels.

Source: National Association of Realtors
At the same time, pending home sales aren't exactly lighting the world on fire. On a year-over-year, three-month average basis, pending sales are up just 3.5%. That suggests that existing-home sales for the year may not grow as fast as the 6% or so rate of 2015. As we have said many times, higher home prices and a lack of inventory continue to weigh on the existing-home market, providing a window of opportunity for new homebuilders.
Home prices continue to ramp up
With the release of Case-Shiller and FHFA this week, we now have a complement of home price activity for the month of January. The data shows that after some divergence all three indexes are showing relatively similar performance with each index increasing 5.8% on a three-month averaged, year-over-year basis.

That's modestly surprising as each index is composed of different types of homes. The FHFA is a very broad index but is limited to government-insured mortgage data. Those mortgages tend to be of higher quality, making them less volatile. The Case-Shiller data is much more geographically limited, just 20 cities, but includes a much broader range of quality. The narrow range of geographies and spread of quality makes this the most volatile of the three indexes.  CoreLogic CLGX is the most geographically diverse index and has a broad range of quality. The geography reduces volatility and the range of quality raises volatility, making it fall between the other two indexes in terms of volatility. The graph below demonstrates the varying volatility as well as the recent convergence.
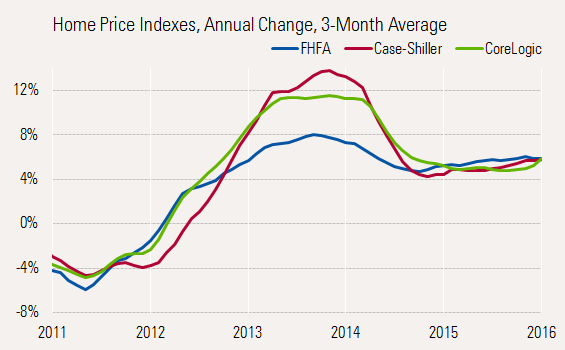
Another interesting difference among the indexes is how close they are to the previous high-level marks, generally reached in 2006 and 2007. All of the indexes have made a great recovery from their low points. In fact, as we have pointed out in earlier columns, the FHFA index is now at an all-time high. At the moment it is just about 2% above the previous high in very early 2007. However, the two broader indexes are still under water. Too, total CPI inflation over that same time frame is approximately 15%. Therefore, on an inflation-adjusted basis home prices of all three real estate indexes are still well below previous highs.

Still, homeowners are continuing to build considerable equity in their homes through a combination of higher prices, the time they are electing to stay in their homes and a higher percentage of monthly payments going to principal (versus interest). These have all helped to build home equity that is likely to help fuel additional consumer purchases over the years ahead. According to the Fed Z1 report, consumer home equity was up over 10% in 2015, or about US$1.2 trillion.
We remain uncertain what the goldilocks level of home price increases is
Clearly, home price increases of 8% (FHFA) to 14% (Case-Shiller 20) by mid-2013 made for a poor 2014 when existing-home sales fell 3%. With slower, more reasonable price growth of 4%-6% by the end of 2014, existing-home sales growth accelerated to 6% or so in 2015. With price growth slightly higher at the end of 2015 than 2014, it seems logical that existing-home sales growth might be a touch lower in 2016, which is very consistent with our forecasts of 3%-4% existing-home sales growth in 2016.
After a busy week, government statisticians take a break: just JOLTS and trade data next week
Most of the major data releases got squeezed in this week, leaving little for next week. The full trade report, including both goods and services, along with inflation adjustments, for the month of February will be the biggest piece of news. With the consumers perhaps not doing quite as well so far in the first quarter, the last thing the economy needs is bad news on the trade report. The preliminary data for February, released earlier this week, showed little change in deficit for goods between January and February. While there was little change in the overall deficit, exports and especially imports, grew compared with January’s relatively poor performance. We caution that the preliminary numbers won’t mean much until we see the inflation-adjusted version next week. We surmise that once adjusted for deflation/inflation, the deficit might have actually improved between January and February.
The job openings report should be an interesting read as hiring has increased a bit and more people have entered the workforce, potentially lowering the number of job openings. Openings running above hiring, as they have been in most recent months, is not an entirely good thing. It may be indicative of continued skills and wage expectations mismatches. The large number of openings that continues to expand indicates that skill issues, and not job availability, is keeping a lid on job growth. Openings decreased in the report for January, and we are expecting further declines in the February report.