


It was a so-so week for most world equity markets, with most developed markets adding about 1% and emerging markets feeling fortunate to get back to the flat line after an ugly start to the week. That early slump was due to more bad news out of China, this time from the manufacturing sector. Markets generally improved over the course of the week, with the economic news on the softer side and a relatively bland statement from the U.S. Federal Reserve. Both slower economic activity and the Fed's ambivalence cast more doubt on the prospects for a September rate increase. The market cheered the potential delay, along with more stabilization in the Shanghai Stock Market and generally better-than-expected earnings news (although there were a few clunkers, too, such as  Whole Foods (WFM). Commodities had yet another bad week, down about 2.5%, led by oil, with the WTI now trading at about US$46 a barrel. That and slow growth in China continued to take their toll on other commodities. About the only piece of the puzzle that did not fit this week was higher interest rates on the 10-Year U.S. Treasury bond that went up from 2.22% to 2.27%. Rather than Fed worries or economic data, the rate was probably driven higher by fewer flight-to-safety buyers as the two problem children, Greece and China, seemed to stabilize.
U.S. economic news was relatively tame, with no big swings in either direction. While the GDP growth rate for the June quarter was a little light at 2.3% growth, a huge markup in the first-quarter report (from negative 0.2% to 0.6%) more than offset that concern. About our only worry with the report was the dominance of the consumer, who accounted for 90% of the overall GDP growth rate. Businesses remained largely on the sidelines with overall growth in business investment shrinking in the second quarter. Exactly how much of that was oil-related is hard to tell, but I would guess it wasn't insignificant.
Largely unnoticed was the Fed's favourite inflation metric: PCE base inflation less food and energy. It ticked up to 1.8% (annualized) in the second quarter, surprisingly close to the Fed's 2% target. If the employment report next week proves strong (not the most likely case), the combination of an improving labour market along with higher inflation may just be enough to push the Fed over the edge in September, when it next votes on a rate increase. However, for all those careful Fed watchers we note that despite the many delays in raising rates, the U.S. stock market has managed to go exactly nowhere for calendar 2015. If you are still watching, the Fed's July release changed a few words that sounded slightly like it was seeing a stronger economy. However, it did not ring the giant, making a September rate increase a foregone conclusion, as they have in several past instances. In other words, it left the door open to do just about anything.
Headline 2Q GDP disappoints; however, with revisions the report met expectations
Headline GDP growth rate for the second quarter on a sequential, annualized basis increased a modest 2.3% versus expectations of an increase of 2.8% and our forecast of 3.0%. The metric also ran below the long-term average of 3.1%. However, the goal posts were moved substantially, as the first quarter now showed growth of 0.6% instead of shrinkage of 0.2%, a rather substantial swing of 0.8%. Adding that 0.8% revision to the reported growth rate of 2.3% produces 3.1%, which seems more like an apples-to-apples comparison to us. So the second quarter wasn't the disappointment that some commentators are making it out to be. In addition, it was a relatively clean quarter with minuscule and offsetting adjustments for inventory and net exports. These two categories have often wreaked havoc on the interpretation of the GDP reports in many recent quarters. For example, falling exports and rising imports deducted almost 2% from the first-quarter GDP report.
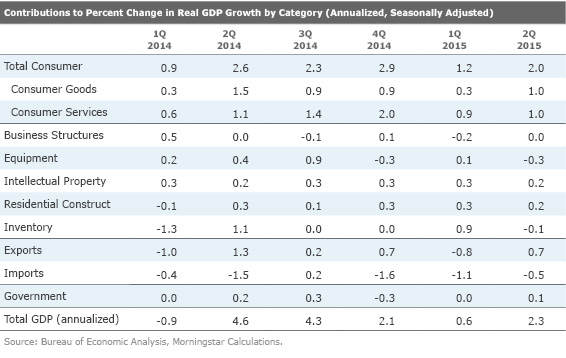
The middle column of the table below shows GDP growth rate on a sequential quarterly basis and then annualized.

This is how most economists report and talk about GDP growth. However, we prefer to use the first column, which compares GDP with the very same quarter a year ago, with no annualization. This substantially reduces the impact of those pesky and inaccurate seasonal adjustment factors. The full-year data in the third column also avoids those issues and rolls four quarters together. That tends to mute the impact of events that may shift from quarter to quarter, but makes it a little more difficult to detect short-term trends. Though affected by the recent revisions, the year-over-year data is still far less volatile and perhaps more indicative of the underlying strength of the economy. Sequential quarterly GDP growth ranged from negative 0.9% to as high as 4.6% while the same-quarter-to-same-quarter year-over-year data is in a much tighter range of 0.9%-2.9%. Note that the year-over-year data has been stuck in the low to mid-2.0% range since 2014 after a period of weakness in 2013 that wasn't quite as obvious in the unrevised data.
Besides the usual suspects, the GDP report also provided the latest reading on the Fed's favourite measure of inflation, the PCE price index. While very similar to the more familiar Consumer Price Index, the PCE measure uses slightly different weights in the index as well as different measures of health-care expenditures. The Fed's goal is to get PCE inflation, excluding food and energy, to 2%. So far the Fed has fallen short on that goal. The report for the second quarter showed that PCE inflation, on a year-over-year basis, was still declining and now stood at 1.3%. However, a lot of analysts took solace in the fact that the quarter-to-quarter data, annualized, now was finally increasing again and stood at 1.8%, within very close range of the Fed's target. If that quarter-to-quarter inflation rate can be sustained, the year-over-year metric should begin to pick up, perhaps as early as the September quarter. Still, the next reading of quarterly PCE will not be available until after the Fed's September meeting.

As we mentioned earlier, the individual GDP sector analysis was boring and uneventful. Consumers, as typical, led the way, accounting for almost all of the GDP growth in the second quarter, 2.0% growth out of the 2.3% total. The next biggest contributor was residential construction, which added about 0.2% to GDP growth. The government sector added 0.1% to the calculation after two quarters of being a moderate detractor. The biggest news of the sector analysis was that total business investment was a small detractor from the GDP calculation. Investment in business structures and also the equipment categories were down while intellectual property (largely software) demonstrated decent growth. Clearly, slow growth in the oil and gas sector is weighing on the business investment category. And as we mentioned earlier, inventories and net investments had next to no effect on the GDP growth rate, for an unusual change.
GDP revisions show slower growth than previously reported
Also incorporated in this report were revisions and modestly new methodologies for the GDP calculation. There were changes in the way that some services were accounted for as well as some new seasonal factors meant to remove some of the winter bust and spring boom that have been befuddling the government statisticians for the past five years. While these are steps in the right direction, the seasonal patterns are still visible and we expect more retroactive adjustments to at least the quarterly GDP growth rates.
We were a bit surprised that a lot more than seasonal factors were adjusted. A combination of methodology changes and revised data sets now showed that already anemic GDP growth this recovery was even worse than originally reported. Between 2011 and 2015, GDP growth has averaged just 2.0% instead of the 2.3% previously estimated. Almost all of the adjustment was for 2013, which now looks like a pretty bad year. Full-year growth for 2013 was reduced from 2.2% growth to just 1.5%. A great deal of that reduction came from just two categories: consumer service and government.


The changes do help explain the surge in employment growth in 2014 but creates some new mysteries relative to earlier years. In 2013, the U.S. economy added 199,000 jobs per month on average and surged to 259,000 jobs 2014. Originally, both years had relatively similar GDP growth rates (2.2% versus 2.4%). It was very hard to explain the surge in job growth with almost no change in GDP growth rates. Now with just a 1.5% GDP growth rate in 2013 and a much higher 2.4% in 2014, the numbers make a lot more sense. However, now the 2013 job growth looks a little out of whack as job growth was very similar in 2012 and 2013 and GDP growth fell relatively meaningfully in 2013. We suppose that job growth is a little sticky on the downside. (Who wants to lay someone off?) More cynically, we will see yet another set of adjustments next year, which may calm some of this volatility.
All-in, our GDP forecast for 2015 and beyond remains at 2.0%-2.5% growth
To get to the middle of our 2.0%-2.5% GDP forecast for 2015, growth in the past two quarters has to average about 2.7%, down slightly from our pre-release forecast. That change relates to revisions to the 2014 data as well as the new data for 2015, more than any change on our overall outlook. Again, consumer and residential real estate should drive most of that growth. The government may begin helping the growth numbers, too. Net exports and business spending remain the biggest unknowns for the back half of the year.
Longer-term we are sticking with our 2.0%-2.5% forecast, too. Demographics (smaller population growth around the world and older, more conservative consumers) are likely to limit the U.S. economy to that type of growth. There is no escape velocity or really any path to get back to the heydays of 3%- 4% growth. That's not necessarily bad news, just a different world. That is, unless one's business plan is based off of those older and higher growth rates.
Pending home sales beginning to ease
The pending home sales report for June showed that pending home sales slipped 1.8% in June to 110.3. This represents the first month-to-month decline in six months. Though, that is really no reason to panic because the June reading is still the second-highest reading of the recovery, behind only the May reading. Still, the pending index has been a great leading indicator lately, correctly predicting the recent boom in existing-home sales. If nothing else, the lower sequential reading combined with a slowing year-over-year reading would seem to suggest that existing-home sales will have a hard time pushing over the 5.5 million homes that closed (final sale) in June. Pending home sales generally turn into final, completed home sales one to three months later, making it a very useful prediction tool. We have been hearing a few other reports suggesting that the market for existing-home sales may be slowing down from a very strong pace, and the pending homes report seems to confirm that.

Home prices stabilizing in the safe range
After a brief slowdown in price increases in the second half of 2014, price gains quickly jumped back into the 5% range in early 2015. That raised a lot of fears that prices were about to heat up too fast (probably anything much over 6% would be worrisome). It now appears that price growth is converging toward 5% for all three major home price indexes that we watch. And the indexes are stabilizing with no real movement in growth trends for most of 2015. At this rate of growth, affordability should remain OK, aiding buyers. Still, the rate of growth is high enough to get owners out from underwater mortgages and to encourage reluctant sellers to put their homes on the market.
As "moderate" as the home price growth might seem, the 5% or so growth rate we are seeing now is still quite a bit above the average annual price appreciation rate of 3.1% that the FHFA is reporting since 1990. That would seem to suggest that there is some room for home price appreciation to moderate in the months and years ahead.
On an interesting side note, average home prices are now down just 1.6% from their peak, according to FHFA data (which is the least volatile of the three indexes). Midway through 2011, home prices on average were 20% or more below the 2007 peak. Again, that's just an average, but it strongly suggests that sellers, limited by underwater mortgages, are a rapidly shrinking group.

Durable goods orders beginning to improve
As we noted above, poor investment spending by businesses is holding back the economy now rather than helping it, as we noted above in the GDP analysis. There were some rays of sunshine on that front from the June durable goods report. The headline durable goods orders report looked surprisingly strong and perhaps artificially high, showing a month-to-month gain of 3.4%. A large jump in aircraft orders aided the overall orders number. Though, even stripping out transportation-related goods, sales were still up 0.8%, the best performance since last August. Durable goods orders had been down seven of the past eight months, so the sequential gain was welcome news for manufacturers. The sector data seems to be indicating that the improvement is broad-based. Six of the seven categories showed order gains and only the primary metals group showed a decline. A still impressive five of seven categories showed an improvement in trend, either growing faster or converting from a downward trend to a positive trend for the month of June.
One word of caution: The year-over-year data is still declining and even the three-month average of the month-to-month growth rates is just now moving into positive territory. I suspect the month-to-month data will continue to improve, but the year-over-year data will continue to face unusually powerful order trends late last summer and fall. So in the months ahead we will focus on sequential growth rates, averaged, along with the diversity of the order growth patterns instead of our usual year-over-year methodology.
![]()
China's manufacturing sector slows again
While we were traveling last week, the flash Markit worldwide purchasing manager data for July was released. Normally I wouldn't go back to last week's data, but particularly poor data out of China may have been part of the reason for the big fall in Chinese stocks in the early part of this week. The Purchasing Manager's Index for China dropped meaningfully from an already lousy 49.4 reading for June to 48.2, indicating that the manufacturing sector is continuing to contract. A combination of weaker world economies (and shipments) and not-so-great internal demand hurt this key economic metric. This follows reports a week earlier that showed Chinese business profits were not performing well. Although the Markit report was for July, it still seems to raise issues about the 7% GDP growth rate that the government is trumpeting for the second quarter.
The European index declined ever so modestly, but was still firmly in growth territory. Perhaps some of the impacts of quantitative easing are already beginning to fade. However, it's equally possible that worries about Greece held back manufacturers in July.

Employment data, manufacturing and auto data on tap for next week
Probably the most important number next week will be the August employment report to be announced on Friday. Expectations are relatively low, with job growth of 215,000 for nonfarm payrolls. That would be below the 223,000 jobs added last month and the 12-month average of 249,000. There was a burst of both GDP growth and employment in mid-2014 that has served to inflate the 12-month average, so some downward movement is no reason for concern. With productivity concerns mounting (the gap between employment growth and GDP growth is unusually narrow) I am not so sure that slower employment growth is a bad thing. Without a GDP growth rate of closer to 3%, it's really hard to imagine going back to those heady days of monthly employment growth of 300,000 or more.
As usual, we will also be watching hourly wage growth closely. After doing better earlier in the year, wage growth was nonexistent in June. Expectations are for wage growth of about 0.2% in the July report, which seems reasonable to us.
Auto sales have been on a bit of a yo-yo lately with the selling day adjustments thoroughly obscuring real underlying trends. July's report should be a little cleaner with the same number of selling days for both years. The consensus is for relatively flat month-to-month sales growth with unit sales of 17.3 million compared with 17.1 million in June and 16.8 million units for July of 2014. If correct, that would mean an anemic year-over-year sales growth rate of 3%. Fortunately for the auto manufacturers, buyers are mainly interested in very high-profit-margin, larger vehicles. So despite not-so-great sales growth, profits continue to move ahead nicely.
ISM manufacturing data should help shed some light on the manufacturing sector. News there has been less bad but certainly not great. Expectations are for the index to slip modestly from 53.7 from 53.5. That reading is still quite healthy, but not lighting the world on fire. Some of the sector data and employment news may prove more interesting than the overall headline reading. Even the import/export comments could provide some important clues to the future direction of the manufacturing sector.


