


What Scottish poet Andrew Lang said of politicians--that they "use statistics in the same way that a drunk uses lampposts"--could also be said of the Investment Funds Institute of Canada's (IFIC) recent effort to illustrate the value investors receive from paying mutual fund fees.
The industry trade group says its recently released infographic on the topic, which coincides with new regulatory requirements under the Client-Relationship Model – phase 2 (CRM2) mandating dollar-value disclosure of advisory fees, is designed to illustrate the impact of fund management, distribution and tax costs on investor accounts.
Given its source, the message to investors isn't too surprising: You're getting a great deal! If a fund's management-expense ratio (MER) is 2.2%--which an IFIC-funded study says is the average asset-weighted cost of funds sold through advice-based channels--just 2.2 cents of every dollar invested gets you professional money management and investment advice. All but a tiny slice of the pie grows along with your investment.
IFIC gets the basic arithmetic of fund expenses right, but it doesn't put them into the proper context. What sounds like a trifling sum in comparison to the size of your overall investment appears quite substantial as a proportion of your investment's returns. Let's say your 60% stock/40% bond portfolio closely matches the 8.4% pre-expense return1 this asset mix has averaged over the past 30 years. An 8% return before fees turns into 5.8% after subtracting the 2.2% MER. What IFIC calls a great value will have eaten more than 25% of your investment returns for the year, as the chart below demonstrates.
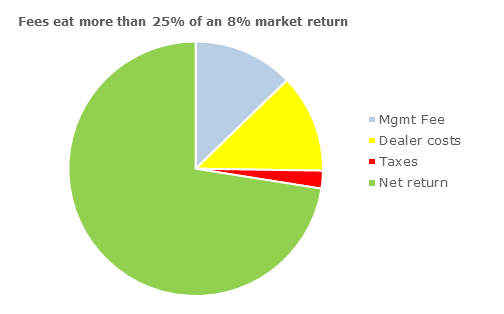
Source: Morningstar. Chart assumes 8% gross annual return and 2.2% in annual expenses.
Market returns mean fund expenses chew up an even larger piece of the pie. This is a reality investors may confront in coming years. While it was plausible to expect 8% gains from a 60/40 portfolio over the prior three decades, investors should expect more subdued long-term returns going forward. With the FTSE TMX Canada Universe Bond Index--the bellwether for the investment-grade bond market--yielding a skimpy 1.8%, it's all but impossible to match the 9% annualized gain it notched over the 30-year period. It's not beyond the realm of possibility a 60/40 portfolio returns 5% instead of 8%. Instead of swallowing 25% of pre-expense returns, the MER would gobble nearly 45%.
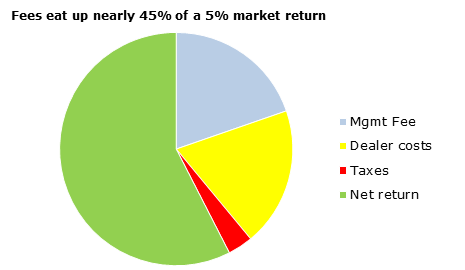
Source: Morningstar. Chart assumes 5% gross annual return and 2.2% in annual expenses.
Thanks to miniscule yields, bond investors will feel the expense pinch the most. The median MER for commission-based core domestic bond funds clocks in at 1.59%, consuming nearly all of the investment grade market's 1.8% yield. Yield typically makes up the better part of bond returns, but that's especially the case these days. The bond market has benefited mightily from the boost it's gotten from three decades of declining interest rates--bond prices and rates move in opposite directions--but with yields at already-low levels, there's not much room for them to fall further. (And if they rise, you're likely to earn negative returns, adding insult to the injury of a yield-swallowing MER.)
The ugly math of fund costs: Where compounding works against you
The harm done by fund fees worsens over time for the same reason your investments grow. If you've shelled out 2.2 cents on the dollar in fees, the 97.8 cents put to work grows exponentially thanks to the magic of compounding. But so does the value of the 2.2 cents paid in fees.
As an example, let's get back to the 60/40 portfolio averaging 8% annual returns before fees with a 2.2% MER. Over a 30-year period, a $10,000 investment will grow to about $54,300 after fees. Over that stretch, the investor will rack up almost $16,800 in investment expenses. However, the opportunity cost is a lot higher. Without fees, $10,000 would rise to about $100,600 over 30 years. The difference between the before- and after-fee balance--more than $46,000--is almost three times what the investor paid in fees. The cost to the investor isn't just $16,700 but also the more than $29,500 in foregone gains. While the MER will have consumed about a quarter of the investment returns on average in a single year, the combined explicit (investment fees) and implicit (compounded value of investment fees) costs will have devoured 45% over a three-decade span.
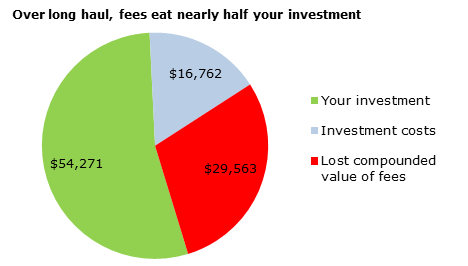
Source: Data generated using Savii Financial Concepts MER Calculator.
Beware of termites
Of course, there's no world where you can invest without fees. Investment managers don't work for free, though low-cost ETFs now offer something not far from it. Paying for financial advice, whether as part of or separate from the MER, chips away at returns on one end, but a capable advisor can more than make up for it on the other by minimizing investment and tax costs, managing asset allocation, and ensuring clients save enough and stick to their financial plan when the going gets rough.
The question, though, isn't whether investment providers should be paid but how much. Because the price you pay comes directly out of your investment returns, less is always better. Even seemingly small costs add up over time. As John Oliver, the host of HBO's Last Week Tonight, more colourfully noted, fees are like termites: They may be small and barely noticeable, but they'll eat your future.
Note
1 Our pre-expense return calculation uses 30-year annualized returns of the S&P/TSX Composite Index and the FTSE TMX Universe Index as of June 30, 2016.


