


Per MSCI, emerging-markets stocks made up about 11.6% of the global stock market (using the MSCI All-Country World Index as a proxy) as of the end of September. Thirty years ago, these stocks represented less than 1% of the world's investable equity market capitalization. These markets are dynamic by definition. They have changed dramatically in the past three decades, and the pace of change has only accelerated in recent years.
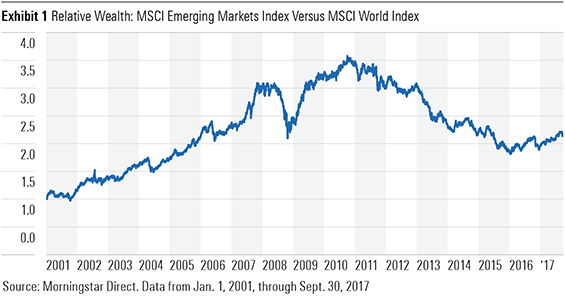
The MSCI Emerging Markets Index was launched on Jan. 1, 2001. From its inception through the end of September, the index's annualized return amounted to 9.89%, versus 4.99% for its developed-markets counterpart, the MSCI World Index (returns are presented in U.S. dollars). Though these headline performance figures are compelling, they belie the gut-wrenching volatility that has characterized this span. During this period, the emerging-markets index's standard deviation of monthly returns and maximum drawdown were 22.07% and 61.59%, respectively. The comparable figures for the MSCI World Index were 15.19% and 54.03%, respectively. Emerging markets' path to greater absolute returns has been a winding one.
Recent years have been particularly taxing for investors in emerging-markets stocks. From the time that the emerging-markets index's cumulative performance peaked relative to developed markets in October 2010 (see Exhibit 1) through the end of 2016, the MSCI Emerging Markets Index fell 1.1% on an annualized basis, while the MSCI World Index generated annualized gains of 8.74%.
But after almost seven lean years, emerging-markets equities have re-emerged in 2017. For the year to date through September, the emerging-markets index increased 27.78%, while its developed-markets counterpart rose 16.01%. Digging into the drivers of the benchmark's year-to-date performance yields some interesting insights into how its complexion has changed in recent years.
Then and now
Exhibits 2 and 3 decompose the portfolio of  iShares MSCI Emerging Markets ETF (EEM) -- the U.S.-listed version of an ETF listed in Canada under the ticker (XEM) -- into its constituent country and GICS sector exposures. It is readily apparent that the composition of this cohort has changed materially over the past few years. From the point of view of country membership, the most significant changes have been the decline in Brazilian stocks' share of the portfolio (from a peak of 16.9% in November 2009 to just 7.2% as of the end of August 2017) and the increase in Chinese stocks' share (which has risen to 28.9% from 15.5% during this same span).

In terms of sector composition, there's been an even more significant shift in the index. In November 2009, energy and materials stocks represented a combined 29.8% of EEM's portfolio. As of the end of August, this figure had declined to 14.1%. Back in 2009, technology names accounted for 15.3% of EEM's portfolio; by the end of August 2017, that figure had increased to 26.9%.
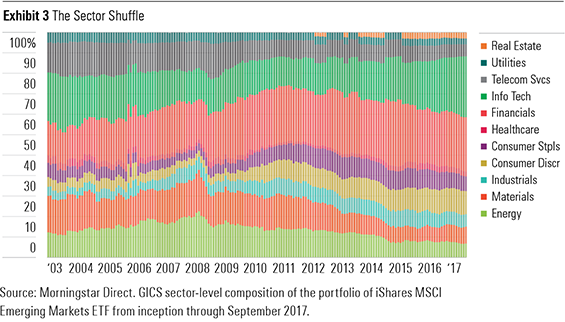
Of course, this evolution is only natural. The MSCI Emerging Markets Index is a broad, market-cap-weighted benchmark. As such, it will reflect the ebb and flow of firm-level fundamentals, investor sentiment, capital flows and so on across these markets. Thus, the shift in the makeup of EEM's portfolio represents the net result of all the above, as manifest in their relative performance. From November 2009 through August 2017, the MSCI China Index gained 6.30% on an annualized basis, while the MSCI Brazil Index declined by 4.15% annualized. These divergent paths speak to the effects of the commodity boom and subsequent bust on Brazil's stock market (and currency) and the emergence of a pair of tech giants in China: Tencent Holdings (TCEHY) and Alibaba Group (BABA).
This brings us to emerging-markets' 2017 reawakening. An attribution analysis of EEM's year-to-date performance through the end of September reveals that the above-mentioned Chinese tech behemoths have combined to account for more than 5 percentage points of the fund's gains. Rounding out the list of the fund's top five contributors are Samsung (SSNGY), Taiwan Semiconductor (TSM) and Naspers (NPSNY), which have collectively added about 4 percentage points to EEM's 2017 effort. The transition from a portfolio dominated by basic materials and energy giants to one led by emerging titans of technology has marked the most recent evolution of emerging stock markets, but what might come next?
What the future might hold
While the makeup of the universe of emerging-markets stocks will inevitably continue to evolve, it is impossible to say what it will look like 10 years from now. That's precisely why many investors choose to invest in this market segment using a broad, market-cap-weighted index fund. However, it's safe to say that country membership and the level of access to previously closed markets will remain in flux.
For example, as part of its 2017 annual market classification review, MSCI announced that it will include China A-shares in the MSCI Emerging Markets and MSCI ACWI indexes. MSCI's decision, which follows FTSE Russell's 2015 launch of China A-share inclusion indexes, is recognition of the significant strides China has made toward opening its capital markets to foreign investors in recent years. Exchange-traded funds and index funds tracking the affected indexes will add some or all of the 222 A-shares earmarked for inclusion to their portfolios and will ultimately respond to any subsequent steps that materialize as part of this longer-term road map toward bringing onshore Chinese stocks into the fold.
While the near-term implications of China A-share inclusion won't move the needle much, it is a significant first step toward greater global integration of the domestic Chinese capital market. The initial A-share inclusion target represents a small weighting in the affected benchmarks (about 0.10% of the MSCI ACWI and 0.73% of the MSCI Emerging Markets Index). Ultimately, these moves will bring China's standing in equity indexes more in line with the true footprint of the nation's capital markets and its economy at large.
Also of note is the fact that both MSCI and FTSE have Saudi Arabia on their short lists for potential inclusion in their emerging-markets benchmarks. Further opening of the kingdom's capital markets and the potential for an initial public offering of Saudi Aramco could have a significant effect on the character of the pool of emerging-markets stocks.
Implications for portfolio construction
Per MSCI's definition, emerging-markets stocks represent about 7% of a globally diversified 60/40 stock/ bond portfolio, at market weight. These stocks' potential contribution to long-term returns is clear but will likely come at the expense of pronounced volatility. As is the case with international stocks more broadly, the prospective diversification benefits of an allocation to emerging-markets stocks may be limited and could even wane with time.
Exhibit 4 shows the rolling three-year correlation between the MSCI Emerging Markets and MSCI World indexes. The level of correlation between developing- and developed-markets stocks has increased significantly since the 2001 launch of the MSCI Emerging Markets Index. This could be attributable to a number of factors.

More widespread recognition of the group as a distinct asset class and greater investment -- particularly by foreign investors -- could be partly to blame. Simultaneously, the degree to which these countries have become integrated into the broader global economy has unquestionably increased. To the extent that these nations' prospects have forged stronger ties to those of more advanced economies, the greater degree of co-movement among their stock markets makes sense.
Also, growth in emerging markets has been a boon for many global firms that have stocks trading on developed-markets exchanges. The MSCI USA With EM Exposure Index selects constituents from the MSCI USA Index and weights them on the basis of the proportion of their revenue derived from emerging-markets countries. The benchmark's largest holding is Apple (AAPL), which received a 13.62% weighting as of the end of September. This underscores the degree of connectivity between emerging and developed markets. It is unlikely this interdependence will diminish anytime soon. As such, it could mean that the correlation between emerging and developed markets will remain elevated, and that the prospective diversification benefits of emerging-markets stocks will diminish from the perspective of a North-American investor.


