See more episodes of Quant Concepts here
Ian Tam: Welcome to Quant Concepts. Although Canadian equity markets have now recovered nicely from the drawdown in Q4 2018, the steep decline in equity prices late last year might still be fresh in some investors' minds. On the backdrop of a global trade war, Brexit concerns and yield curve inversion, many investors may err on the side of caution when it comes to their equity investments now more than ever. With the help of Morningstar CPMS, today, I will look at some of the fundamental characteristics that seem to have outperformed the market in the fourth quarter of 2018 and then use these exact same metrics to build a rules based model to understand if they would have worked over a much longer timeframe.
So, to start off with, I'm going to run a screen using data from the end of December 2018, basically measuring total return over the last three months from that point in time. So, you can see on my screen here, we have a number of stocks. Each of these stocks showed positive returns at the end of December 2018 over the trailing three months. So, you can see there's a number of gold stocks in here, some consumer defensive, and a few other picks from across the economy.
So, what I'm going to do next is take this portfolio of 33 stocks, and I'm going to run a Morningstar CPMS factor attribution report. And the point of this report is basically to measure the fundamental characteristics of an equally weighted portfolio against the fundamental metrics of the broad market. And today, I'm going to use the S&P/TSX Composite on an equally weighted basis as a representation of the broad market in Canada.
So, to outline this report, I'll read one line to the audience today. And this should be pretty clear what we're showing. So, if I held all the stocks in the S&P/TSX Composite today on an equally weighted basis, my yield would be roughly 3%. However, if I held all the stocks in this equally weighted portfolio of 33 companies, my yield will be 2.5%. So, a little bit lower than the broad index. So, yield is one metric. I've run that same analysis over multiple metrics, some dividend-oriented metrics, growth metrics, valuation, safety, so on and so forth. And what I did here was I used the data from the end of September of 2018, before the market correction, to understand which metrics show best for these best performing stocks. I noticed a few things on this portfolio of companies.
Firstly, I noticed that the companies have lower beta than the market, and beta measures the sensitivity of the stocks' movement against an index. I also noticed that the consistency of earnings over 5 years and 10 years for these stocks seem to be lower or more consistent than the market. And I also noticed that the spread in estimates seem to be lower. So, what that means is basically companies that are in this portfolio seem to draw a similar opinion from sell-side analysts on the street, more so than the general market. And finally, I also noticed that the growth rate of dividends both on a forward-looking as well as on a trailing basis seem to be better than the market.
So, using those very specific factors, I wanted to see if building a model around those factors would have worked over a much longer timeframe. So, of course, I'll use CPMS to build that model. And today, what I'll do is I'll basically weight the factors as I displayed on the screen. So, I put a 20% emphasis on the 5-year price beta; I've put a 20% emphasis on the consistency of earnings historically, both over 5 years and 10 years; I'll also put 20% on dividend growth rate both on an expected basis as well as on a trailing basis; 20% on spread and estimates; and 20% on the 3-month estimate revision. So, that's today's consensus estimates versus what it was three months ago. And of course, we want that to be moving in the positive direction.
I then use Morningstar CPMS to back test this strategy. What we're doing is starting with $1 million cash prior to the tech bubble. Using no more than 5 stocks per economic sector, I picked 20 stocks. At the end of each month, if any of the stocks fall below the top 35% of the TSX Composite based on those factors, I would sell the stock and immediately replace it with the next highest-ranking stock, never owning more than 5 stocks per sector. For today's analysis, I have excluded management fees or transaction costs. So, please keep that in mind when you're looking at these results.
Okay. So, looks like our back test is finished up here. The strategy that I've created using those factors returned an annualized return of 9.8%, which is better than the S&P/TSX Composite by roughly 3.5%, again, on an annualized basis. The Sharpe Ratio on this – and as a reminder, the Sharpe Ratio measures your risk-adjusted return or how much return you're getting per unit of risk – is about 0.8. When compared to TSX Composite, that's a lot better, meaning you're getting more return per unit of risk. The Sharpe Ratio on the TSX Composite or the benchmark is about 0.3.
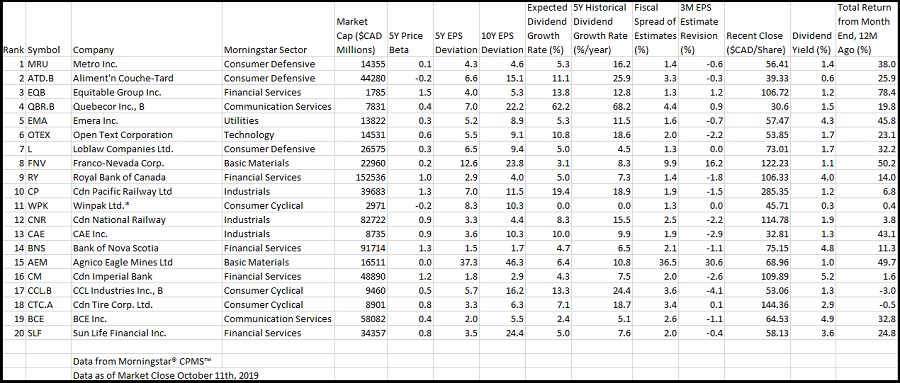
More importantly, we want to look at how this strategy would have behaved in down markets. So, if you look at all the quarters over the last 20 years or so, of the quarters where the TSX Composite showed a negative return, this strategy beat the market about 72% of the time, which again, talks to the defensive nature of these particular characteristics. So, the stocks that meet the requirements to be purchased into the model today will be listed in the table accompanying the transcript to this video.
For Morningstar, I'm Ian Tam.