See more episodes of Quant Concepts here
Ian Tam: Welcome to Quant Concepts. Last year, the S&P 500 Total Return Index gained 31.5%. Certainly, a substantial year echoed by the fact that the median stock total return in the U.S. was 24.1%. Today, I'll use Morningstar CPMS to find companies that have shown a consistent history of profitability and quality but for one reason or another were unloved by the market during last year's rally.
So, having a look at my screen here, you'll see I created a model using Morningstar CPMS. What we're going to do in the first step of the model is rank all the stocks in our U.S. database, which consists of about 2,100 companies or 95% of market cap, by a number of different quality-focused metrics. So, on the pie chart on the screen, you'll see I have two metrics that are based on standard deviation or basically consistency of a measure. The first one is going to be standard deviation of return on equity. Return on equity is known fairly widely as a quality or profitability metric. And we're basically looking for companies that are fairly consistently profitable over the last five years. We're also looking at the five-year variability of earnings, again a standard deviation type measure, which again measures the consistency of a company's reported earnings over the last five years.
I'm also going to look at the growth rate or the level of profitability over the last five years as well. 14% of my model here on the pie chart is looking at the average ROE or average return on equity over the last five years. And we're looking as well at the earnings per share growth rate or on average how much earnings are growing each year in the last five years. And then, in terms of shorter-term metrics, I'm also looking at the latest reported return on invested capital which looks at both debt and equity. And of course, just return on equity, which, of course, just looks at the equity portion of a company's capital structure. So, together, this makes up the factors that are going to rank the stocks that I model today from best to worst or from number one to number 2,100 or thereabouts.
Now, to look for the companies that didn't do so well last year, I'm going to put a screen on that list of stocks. So, the first thing I'll do is look at the top quartile or top 25% of companies that rank really well in terms of their quality based on the pie chart. And then, right away, I'm going to put a screen on the total return from a month and one year ago, or roughly the 12-month total return. And what I'm going to say here is the total return over that timeframe has to be between negative 15% and negative 5%. So, we want some, I guess, poorer performers relative to the rest of the universe last year, but not overly so. So, not worse than negative 15%. We also want all the return on equity, return on invested capital and all the other quality metrics to be positive. And lastly, to exclude illiquid or less liquid names in the U.S. universe, I'm using a market cap screen of about $1.2 billion, which excludes the bottom third of market cap in the U.S. market. And very lastly, I'm going to put a screen on the estimate revisions. I want to make sure that the analysts’ sentiment on the stocks that I'm picking from aren't overly negative. I put a little limit of negative 5% revision over the last three months to make sure the analyst sentiment is generally positive on those stocks. So, those are my buy rules.
And in my sell rules, I'm saying that if the stock drops beyond the top 35% of my universe in terms of those quality metrics in the pie chart, I will sell the stock. And basically, if any of the profitability or even the earnings numbers in my screen go negative, I will also sell that stock. One last piece here; if the estimates drop by more than 10% over the last three months, that's another reason for me to sell that stock. So, that's my model today. And of course, this is very easy to backtest using Morningstar CPMS. I'm going to do that for you today.
So, in the backtest process, of course, we're going to start with some number of stocks. I've limited this model to 15 stocks with no more than four stocks per economic sector, starting with $1 million in 2004. And at that point in time, I used $1 million to purchase the best 15 stocks that met all the requirements to be bought into the model. At the end of each subsequent month, I'm checking to see if any of the sell requirements are broken. If they are, I sell the stock, and again, immediately replace it with the next highest-ranking stock not already held in the model, but no more than four stocks per economic sector.
So, looking at the backtest results, you'll see that the model returned 11.2% annualized and when compared against the S&P 500 Total Return Index, that's better than the index by about 190 basis points or 1.9%, again, on an annualized basis. The Sharpe Ratio, which is your risk-adjusted return or you return per unit of risk, over the longest timeframe is about 0.8, which is better than the index by 0.2 in terms of Sharpe Ratio. The Sharpe Ratio of the index was 0.6 over that time. So, certainly, a better risk efficiency in terms of using your assets. We also want to look at how the model performed in down markets. So, if you look at all the quarters over the last 15 years or so, where the market was down, the strategy beat the index about 81% of the time.
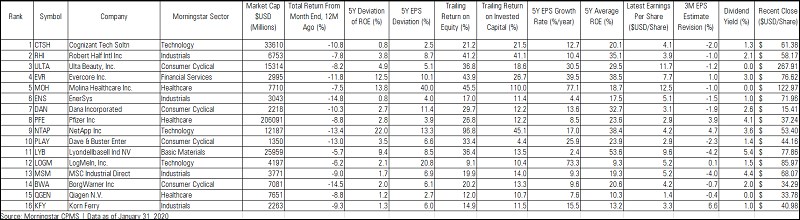
So, the idea here is to show viewers that although not all companies will meet the gangbuster returns of the index last year, it doesn't mean that there aren't great quality companies out there. There's going to be a few examples of this in today's screen. And over time, of course, picking profitable, quality, consistent companies do tend to reward investors over the long term. So, the stocks that meet the requirements to be purchased into the model today are going to be listed in the table attached to the transcript for this article.
For Morningstar, I'm Ian Tam.