See more episodes of Quant Concepts here
Phil Dabo: Welcome to Quant Concept's working from home edition. The consumer cyclical sector tends to perform well during an economic expansion, and it can also be a good place to find stocks during a recovery. The Canadian industrial sector might also be a good place to look for companies that aren't heavily owned by investors.
Today, let's take a look at a strategy that combines the Canadian consumer cyclicals sector with industrials and see if we can find some companies that can add diversification to your portfolio with some additional returns at the same time.
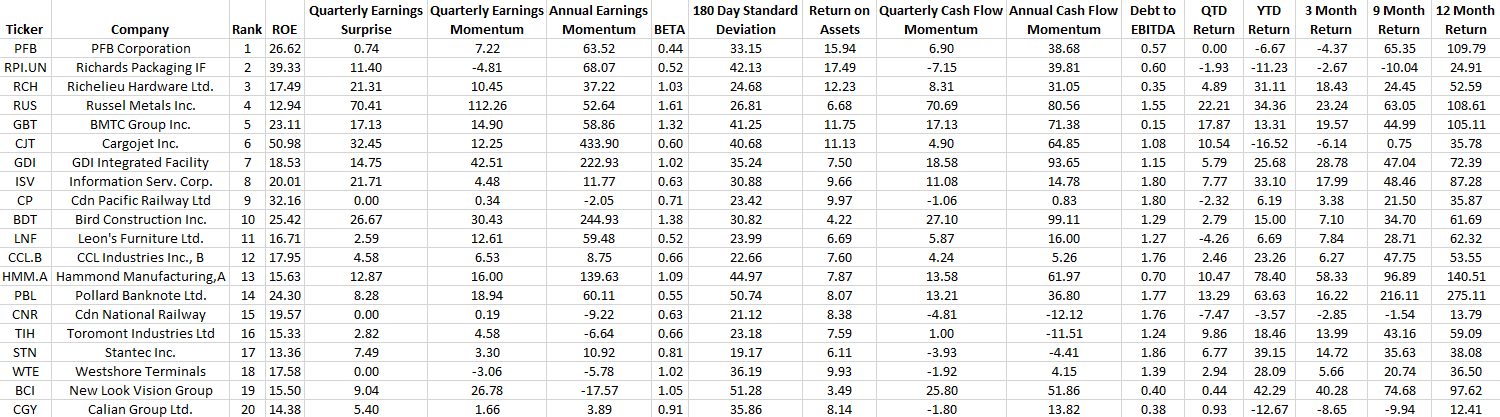
Now, let's take a look at our strategy. We are going to start by selecting our universe of stocks. In this case, we are going to make a universe of stocks that includes all industrials and consumer cyclicals. Next, we are going to rank our stocks from 1 to 115 according to five key factors.
The first factor is our return on total assets, which is an indicator of how effectively a company is using its assets to generate earnings. The next two factors are the quarterly cash flow momentum and the annual cash flow momentum, because ideally, we'd like to identify companies that have been generating more cash. The next two factors are meant to reduce volatility. The 180-day standard deviation will try to reduce price volatility. And the last factor is beta in order to reduce the overall market volatility in the model.
Now, let's take a look at our buy rules, and our buy rules are very simple. We are only going to buy stocks that rank in the top 30th percentile of our list. Our second screen is the return on equity, which is a widely known measure of financial performance that measures the profitability of a company in relation to shareholders equity. The next rule is very interesting. It combines the quarterly earnings surprise, quarterly earnings momentum and annual earnings momentum, and it basically says that it's okay for any of the variables to be below 0 as long as they are not all below 0 at the same time. The next rule is the five-year beta, which places an upper limit of 2, and the model will only buy stocks if the debt to EBITDA ranks in the top two-thirds of our list.
Now, let's take a look at our sell rules, and our sell rules are also very straightforward. We are only going to sell stocks if they fall out of the top 45th percentile of our list, and we are also going to sell stocks if the debt to EBITDA deteriorates and falls to the bottom third of our list.
Now, let's take a look at performance. The benchmark that we used is the S&P/TSX Total Return Index, and we tested this strategy from January 2006 to April 2021. Over this time period, the strategy has generated a very strong 15.5% return, which is 9.3% higher than the index with only a 34% annualized turnover. The strategy has also had very strong annualized returns and has outperformed the benchmark over every significant time period. Although the strategy does have slightly higher price risk, as you can see by the standard deviation, it still has very good risk-adjusted returns as you can see by the Sharpe Ratio.
An additional benefit of this strategy is that it has slightly lower market risk, as you can see by the beta. When looking at this chart, you can see very good outperformance over time, especially over the past year. And when we look at the market capture ratios, we can see that this is a strategy that has performed well in down markets and still is capable of capturing some of the upside of the markets, which shows that this is a strategy that has performed well throughout different market cycles as you can see by the overall market capture ratio.
This is a great strategy for identifying companies that are in the industrial and consumer cyclical sectors as long as you are comfortable with higher volatility. Overall, this strategy has outperformed the S&P/TSX over every single calendar year except for 2019, and it's currently trailing the index by 2% year-to-date.
Some of the stocks in the buy list can provide great diversification by sector and by market cap if you have more exposure to large cap Canadian stocks with a heavier weight on the S&P/TSX. You can find the buy list along with a transcript of this video.
From Morningstar, I'm Phil Dabo.
For a higher resolution image of the buy list, click here.