


See more episodes of Quant Concepts here
Phil Dabo: Welcome to Quant Concepts working from home edition. Mid cap stocks tend to have a market capitalization between $2 billion to $10 billion and they can really add returns to your portfolio because they have a lot more room to grow than larger cap stocks. An additional benefit of investing in medium sized companies is that they can achieve higher returns similar to small cap stocks, with lower risk that is comparable to larger cap stocks. Mid cap stocks are still very nimble because they don't have the same scale as larger companies. So they can benefit even more during economic expansion, because it can move their resources around more quickly to take advantage of business opportunities. Today, let's take a look at a strategy that focuses on mid cap growth stocks.
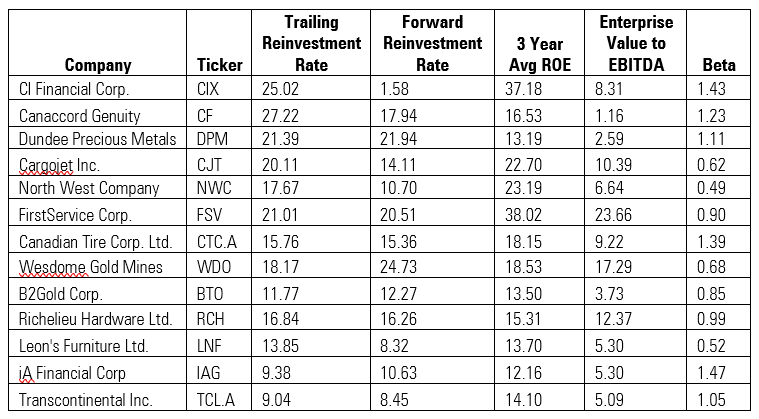
As always, let's start by selecting our universe of stocks which includes all 700 companies in our Canadian database. Next, we're going to rank our stocks from 1 to 700, according to five key factors. The first two factors are the trailing and forward reinvestment rate. This will make sure that we are identifying companies that have been reinvesting in growth opportunities and are expected to do so for the foreseeable future. The next two factors are the trailing return on equity and the average return on equity over the past three years. The ROE is a good metric of financial performance that takes into consideration the profitability, leverage and return on assets of a company. We want to make sure that companies currently have a strong ROE. And they've been able to maintain that over the past three years.
Our last ranking criteria is the enterprise value to EBITDA, which is a popular metric used in corporate finance to assess the value of a company. Now that we have our stocks ranked from 1 to 700, we can go through our screening process, by starting with our buy rules. We're only going to buy stocks if they rank in the top 20th percentile of our list. And we're going to place a market cap limit between $1.3 billion and $13 billion. So that we focus on mid cap stocks. We want a minimum of 8% on our trailing reinvestment rate and our forward reinvestment rate. And we also want a minimum of 10% for our trailing return on equity and our average return on equity for the past three years.
We're only going to buy stocks that have a beta of less than 1.5, because we want to reduce the amount of volatility in the model. A beta of less than 1 means that the stock is less volatile than the S&P/TSX, but a limit of 1.5 on beta will make sure that we're not buying stocks that are very volatile. Our last buy rule is the three-month earnings revision, because we want to make sure that analysts have a positive outlook on earnings per share. Now let's take a look at our sell rules, which we've kept very simple. We're only going to sell stocks if they fall out of the top 30th percentile of our list.
Now let's take a look at performance. The benchmark that we used is the S&P/TSX Total Return Index. And we tested the strategy from January 2006 to June 2021. Over this time period, this strategy generated a very strong 16.3% return which is 9.8% higher than the benchmark with only a 22% annualised turnover. We can see by looking at the annualised periods, that this is a strategy that has outperformed the index over every significant time period, especially the past 10 years, since we've been in a strong growth environment. This strategy comes with a slightly higher standard deviation, which measures price risk. However, you can see by the Sharpe ratio, that this is a strategy that generates very good risk adjusted returns, especially over the 10-year period. It's also worth noting that this is a strategy that has slightly lower market risk as you can see by beta.
When looking at the performance chart, we can see very good outperformance over time, especially over the past 10 years. And when looking at the up and downside capture ratios we can see very strong performance in both up and down markets, which contributes to a very good overall market capture ratio showing that this is a strategy that has performed well throughout different market cycles.
This is a great strategy to consider if you're looking for medium sized companies that can benefit from a rebound in the economy. It has great performance compared to the S&P/TSX, which has a heavier bias toward large cap equities. If you take the weight on the S&P/TSX for all of the stocks on the buy list it will add up to less than 2.5%. This means that these stocks will do a great job of diversifying your portfolio if you have more exposure to larger cap equities. You can find the buy list along with the transcript of this video. For Morningstar I'm Phil Dabo.


