
Environmental, social, and governance factors are being greatly emphasized in investing these days. Unfortunately, there is some confusion about what it means to incorporate ESG into the investment process. This is because there are two sides of ESG that must be kept distinct when building a portfolio:
- Pecuniary ESG: This is the impact that ESG factors have on the risk and expected return of securities issued by a company.[1]
- Nonpecuniary ESG: This is the impact that ESG factors have on how desirable investors find securities apart from their risk and expected return. For example, investors may prefer stocks issued by green companies because of their personal values and concerns about the environment.[2]
In this issue of Quant U, I present a framework for understanding how both pecuniary and nonpecuniary ESG can have an impact on how investors form portfolios in an equilibrium[3] setting using an ESG-specific version of the popularity asset pricing model, or PAPM, which I have discussed in previous issues of Morningstar magazine.[4] The model I present here is similar to one in the academic literature on ESG.[5]
Equilibrium With Pecuniary ESG Views and No Nonpecuniary Preferences
According the PAPM, investors can form portfolios based on pecuniary factors (risk and expected return) and possibly any number of nonpecuniary factors. Furthermore, investors can have different views regarding pecuniary factors. In the ESG version of the PAPM I discuss here, I assume that investors have one of two pecuniary views: ESG-unaware and ESG-aware.[6] For now, I assume that no investors have nonpecuniary preferences, but I will introduce those who do into the model later.
To model the impact of investors having different ESG views, I formed a simple model in which there are two stocks (ESG-positive and ESG-negative) and two investors (ESG-unaware and ESG-aware).
The PAPM is an extension and generalization of the capital asset pricing model, or CAPM.[7] Both the CAPM and the PAPM are single-period models in which investors trade securities (stocks and cash) at the beginning of the period and receive the payouts of the stocks at the end of the period. In the ESG-unaware view, I assume that the two stocks have the same expected payout but differ in the standard deviations of their payouts as well as in their systematic risks (betas). I assume that the ESG-positive stock has both greater total and systematic risk, so that it is both riskier and has a greater expected return than the ESG-negative stock.
I assume that the ESG-positive stock is issued by a company with good ESG practices that contribute to its expected payout being greater than that in the ESG-unaware view. Similarly, I assume that the ESG-negative stock is issued by a company with poor ESG practices that contribute to its expected payout being less than that in the ESG-unaware view. The ESG-aware view takes the ESG practices of both companies into account, while the ESG-unaware view ignores them, leading to a less accurate estimate of expected payout. To keep the example symmetric, I subtract the same amount from the ESG-negative stock’s expected payout as I add to the expected payout of the ESG-positive stock.
I assume that both investors have no nonpecuniary preferences and identical pecuniary preferences for risk and expected return (that is, the same risk tolerance). Hence, as in the CAPM, each investor seeks to maximize risk-adjusted expected return.[8] I also assume that they have equal amounts of capital.
Exhibit 1 shows the expected returns and standard deviations of the stocks and investor portfolios under equilibrium under both the ESG-unaware and ESG-aware views. Under both views, the ESG-positive stock has the same standard deviation but a higher expected return. Similarly, under both views, the ESG-negative stock has the same standard deviation but a lower expected return. Taking all possible portfolio combinations of the two stocks (both long and short positions) under the ESG-unaware view results in the ESG-unaware frontier (which is not the true frontier, as it fails to incorporate pecuniary ESG factors). Similarly, taking all possible portfolio combinations of the two stocks under the ESG-aware view results in the ESG-aware frontier (which is the true frontier, as it correctly incorporates pecuniary ESG factors). Note how the ESG-aware frontier is higher and wider than the ESG-unaware frontier.
As in the standard CAPM, each investor holds a portfolio on a line that is tangent to his or her estimated frontier, emanating from the point that represents the risk-free asset (cash). Each of these portfolios is mean-variance-efficient under the respective investor’s view. As Exhibit 1 shows, in the model that I present here, the frontiers under both views have the same tangent line.
However, the portfolio represented by each point on the line depends on which view is in effect. In fact, the portfolios of both investors are on the same point, even though, as Exhibit 2 shows, their compositions are different.
Interestingly, the market portfolio has the same expected return and standard deviation under both views. However, because it is below the tangent line, it is not mean-variance-efficient under either view.
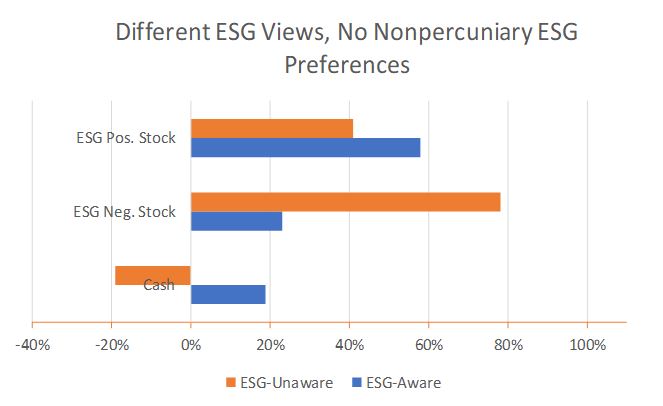
Exhibit 2 provides the details on the portfolios shown in Exhibit 1. Under the ESG-unaware view, the tangent portfolio is about 66% in the ESG-negative stock. The investor with the ESG-unaware view holds a leveraged position of this tangent portfolio, going short about 19% in cash.
In contrast, under the ESG-aware view, the tangent portfolio is about 72% in the ESG-positive stock. The investor with the ESG-aware view combines this tangent portfolio with about a 19% long position in cash, which offsets the short position in cash of the other investor.
Exhibit 1: Equilibrium with Different ESG Views and No Nonpecuniary Preferences
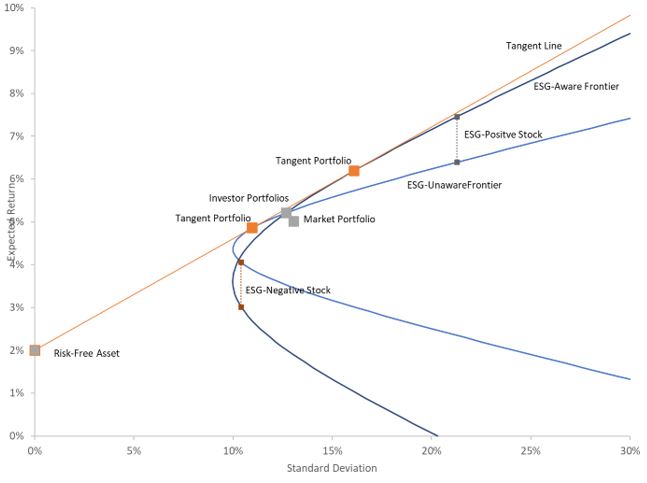
Exhibit 2: Details of Portfolios Under Equilibrium with Different ESG Views and No Nonpecuniary Preferences
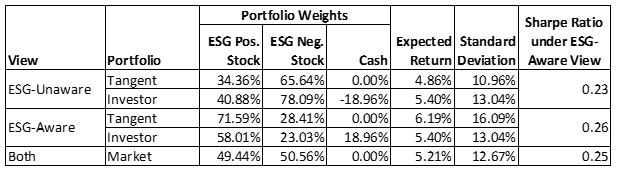
In Exhibit 2, I have included the Sharpe ratios of each portfolio under the ESG-aware view.[9] The Sharpe ratio measures the mean-variance efficiency of a portfolio. Under the ESG-aware view (correct view), only the ESG-aware investor holds a mean-variance-efficient portfolio. The ESG-unaware investor inadvertently holds an inefficient portfolio. Because the market portfolio is a blend of efficient and inefficient portfolios, it is inefficient.
Different ESG Views and Nonpecuniary Preferences
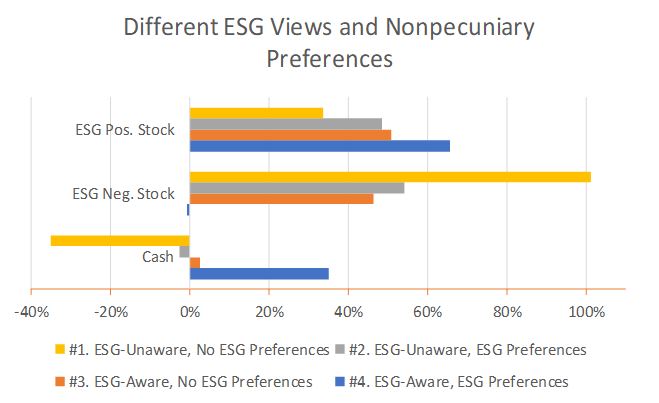
To introduce nonpecuniary preferences into the model, I now assume that there are four investors, all with the same level of capital:[10]
- No. 1 holds the ESG-unaware view and has no nonpecuniary ESG preference.
- No. 2 holds the ESG-unaware view and has a nonpecuniary ESG preference.
- No. 3 holds the ESG-aware view and has no nonpecuniary ESG preference.
- No. 4 holds the ESG-aware view and has a nonpecuniary ESG preference.
There can be trade-offs between nonpecuniary ESG and pecuniary risk-adjusted expected return. Investors who have no nonpecuniary preferences seek to maximize risk-adjusted expected return, while those with pecuniary preferences seek to balance nonpecuniary ESG exposure and risk-adjusted expected return.
Exhibit 3 illustrates how this works. Based on the ESG-aware view, it shows the pecuniary/nonpecuniary frontier. Each point on this frontier gives the highest possible value of risk-adjusted expected return for a given level of nonpecuniary ESG exposure.[11]
As this exhibit shows, investors who have no nonpecuniary preferences (Investor No. 3) select whatever level of nonpecuniary ESG exposure goes with the portfolio with the highest level of risk-adjusted expected return. In contrast, investors with nonpecuniary preferences (Investor No. 4) give up some risk-adjusted expected return to gain some nonpecuniary ESG exposure. To what extent they make this trade-off depends on (1) the curvature of the frontier and (2) the strength of their nonpecuniary preferences.
In Exhibit 3, I have included an indifference curve, which is a line that is tangent to pecuniary/nonpecuniary frontier.[12] The slope of this line shows how much risk-adjusted expected return the investor is willing the give up to gain nonpecuniary ESG exposure, based on his or her nonpecuniary preferences. The point of tangency with the frontier shows where the investor ends up.
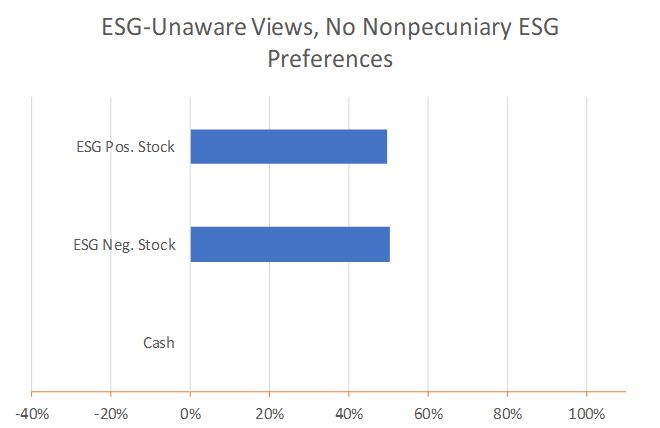
Exhibit 4 shows investor portfolios under three sets of assumptions:
- Investors have ESG-unaware views and no nonpecuniary preferences.
- Investors have different ESG views and no nonpecuniary preferences.
- Investors have different ESG views and nonpecuniary preferences.
The first set of assumptions gives us the CAPM with identical investors. The result is that all investors hold the market portfolio, which here is about 50% in the ESG-positive stock and 50% in the ESG-negative stock. The second set of assumptions is the model that I presented in exhibits 1 and 2. I have included it here to contrast it with the other models. The third set of assumptions is the model with four investors. Note how as we move from Investor No. 1 to Investor No. 4, the holdings on the ESG-positive stock increase and the holdings on the ESG-negative stock decrease. This shows how both pecuniary ESG awareness and nonpecuniary preferences have an impact on the ESG exposure of a portfolio.
Exhibit 3: Pecuniary/Nonpecuniary ESG Frontier and Investor Decisions
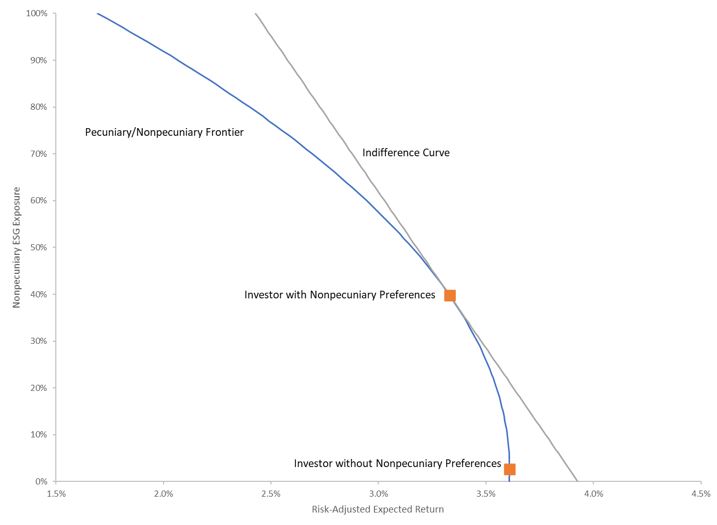
Exhibit 4: Investor Portfolios Under Alternative ESG Assumptions
Trade-Offs
The PAPM is a powerful and flexible model that allows us to incorporate both differing economic pecuniary views and nonpecuniary preferences. It is, therefore, especially well-suited to address the impact on both pecuniary and nonpecuniary ESG factors in a single model to address how these factors affect asset prices and investor portfolios. The model that I presented here demonstrates the impact of both ESG views and preferences. Furthermore, it shows the possible trade-offs between nonpecuniary ESG exposure and pecuniary risk-adjusted expected return that investors may need to make. Recognizing the distinct impacts of ESG views and preferences and the pecuniary/nonpecuniary trade-off are the main lessons from the ESG version of the PAPM.
Paul D. Kaplan, Ph.D., CFA, is director of research with Morningstar Canada. He is a member of the editorial board of Morningstar magazine.
The author thanks Ryan Murphy and Thomas Idzorek for their helpful edits and comments.
[1] The Sustainalytics ESG Risk Rating, which is the basis for the Morningstar Sustainability Rating for Funds (the globe rating) is a pecuniary ESG rating.
[2]The Sustainalytics ESG Rating, which is distinct from the ESG Risk Rating, is a pecuniary ESG rating.
[3] An asset market is in equilibrium when the prices are such that the demand for each asset matches its supply. I assume this is the case throughout this article.
[4] In Kaplan (2018a) and (2018b), I discuss the PAPM as presented in Ibbotson, Idzorek, Kaplan, and Xiong (2018). See also Rekenthaler (2019). In Kaplan (2019), I discuss PAPM with heterogeneous expections as presented in Idzorek, Kaplan, and Ibbotson (2020).
[5] This is Pedersen, Fitzgibbons, and Pomorski (2020, hereafter PFP). PFP present a PAPM-like model with both pecuniary and nonpecuniary ESG.
[6] I adopted this terminology from PFP.
[7] Alternatively, we can say that the CAPM is a special case of the PAPM in which everyone has the same expectations and no additional preferences beyond risk aversion.
[8] I am using risk-adjusted expected return as a descriptive term for an investor’s utility function in the CAPM. This is , where µ is the expected return of the investor’s portfolio, s is the standard deviation of return on the investor’s portfolio, and l is the investor’s risk aversion coefficient.
[9] The Sharpe ratio of a portfolio is , where µ is the expected return of the portfolio, rf is the risk-free rate, ands is the standard deviation of return on the portfolio.
[10] The PFP model has three types of investors who are like investors No. 1, No. 3, and No. 4. They do not include No. 2.
[11] PFP present a similar frontier but use the Sharpe ratio rather than risk-adjusted expected return as the pecuniary measure.
[12] An indifference curve shows combinations of two quantities, which the investor is indifferent to holding. If the two quantities are both desirable to the investor, the further up and to the right an indifference curve is, the more desirable the combinations it represents. Because the frontier gives the highest feasible combinations, the indifference curve that is tangent to the frontier, at the point of tangency, gives the combination that the investor holds.
References
Idzorek, T.M., Kaplan, P.D., & Ibbotson, R.G. 2020. “The Popularity Asset Pricing Model.” Working paper. December.
Ibbotson, R.G., Idzorek, T.M., Kaplan, P.D., & Xiong, J.X. 2018. Popularity: A Bridge Between Classical and Behavioral Finance. Charlottesville, VA: CFA Institute Research Foundation.
Kaplan, P.D. 2018a. “Build Bridges, Not Walls.” Morningstar magazine. April/May.
Kaplan, P.D. 2018b. “The Popularity Asset Pricing Model.” Morningstar magazine. June/July.
Kaplan, P.D. 2019. “A Matter of Opinion.” Morningstar magazine, Winter.
Pedersen, L.H., Fitzgibbons, S., & Pomorski. L. 2020. “Responsible Investing: The ESG-Efficient Frontier.” Journal of Financial Economics.
Rekenthaler, J. 2019. “Putting a Price on Popularity.” Morningstar magazine. Summer.