
Fund Fact Documents are extremely useful. Investors should look over them clearly, as they state key bits of information about your mutual fund (or exchange traded fund – ETF) including a short blurb about how the fund invests, what its top holdings are, its historical performance, as well as how much you pay in fees each year to own the fund.
In Canada, it is required that a Fund Facts (or ETF Facts) document be provided to you before you purchase one of these investment vehicles. In the case of discount brokerages, this document is provided to you immediately following your purchase.
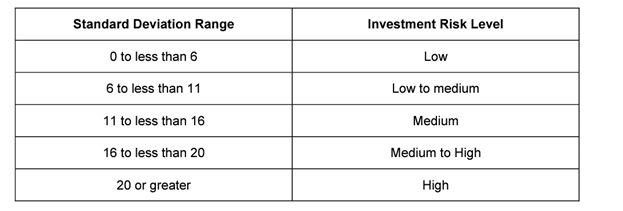
Another important piece of information in the document is the fund’s measure of risk. Here’s what that section of the fund fact sheet looks like:

Source: https://www.getsmarteraboutmoney.ca/tools/fund-facts-interactive-sample/
The intent of this rating is to give an investor a very broad idea of how risky a fund has been historically. Behind the scenes is a reasonably simple calculation, as stipulated by the Canadian Securities Administrators in their 2016 guidance. For those mathematically inclined, the “risk rating” stated on the Fund Facts document is indeed a 10-year standard deviation of returns with a table that translates to an Investment Risk Level or Risk Rating:
Source: https://www.osc.ca/sites/default/files/pdfs/irps/ni_20161208_81-101-81-102_csa-mutual-fund-risk.pdf
Funds that have steady returns (like money market funds) will have very low variation in returns resulting in a lower risk level, while equity funds move around much more and hence will have higher risk levels. Though on paper it would seem like this is a good measure on which investors should rely when making investment decisions, that is not true. Here's why
Why the Fund Fact Document Risk Rating Doesn’t Work
The calculation treats volatility in the positive direction (say if a fund rises 50% in a day) the way it does in the negative direction (if a fund loses 50% in a day). This is now not how most investors think about risk. Most investors would probably be okay with a fund’s value rising rapidly. They would not be okay with a fund’s value falling rapidly. Standard deviation treats both sides of this coin the same.
The rating uses 10 years’ worth of monthly returns. Given that we’re now in 2022, the calculation now excludes the returns during the 2008-2009 financial crisis, which would be a critical litmus test to understand how a fund manager endured a systemic market correction. Moreover, if we had calculated the risk rating using 15 years of data instead of 10, the results would be very different, as can be seen below:
The above table compares what a conceptual “risk rating” would be, had we used 15 years’ worth of monthly returns instead of 10 for all Canadian-domiciled mutual funds and ETFs with an inception date prior to April 1, 2007. Here, we can see that there are 451 funds that today would be rated “low to medium” risk on a fund facts document. If we instead use 15 years’ worth of data, a whopping 156 of those funds would actually be rated “medium.” In other words, using less data makes these funds appear less risky.
When a fund’s 10-year standard deviation crosses a threshold (say from 5.9 to 6.1), the rating itself changes (from “Low” to “Low to Medium”). For the unknowing investor, this might cause a reason for pause where in reality the actual historical volatility has not materially changed. This happens more often than you think. In a comment letter to both IIROC and MFDA last year, Morningstar also urged advisors not to rely on the risk rating for the same reason.
What Our Study Found on Risk Ratings of Canadian Mutual Funds
To create this study, we took the oldest share class of every mutual fund and ETF with at least a 10-year history in our Canadian database and calculated the risk rating as it would have appeared each July from 2015-2021. We then counted the number of times a risk rating changed according to the CSA’s methodology.
Of the 62 money market funds that had a 10-year history, none of them changed risk ratings, which is intuitive.
However, when you look at allocation (aka balanced) funds, a good chunk of them changed risk ratings twice in the span of six years which is of concern as the majority of Canadian assets are invested in balanced funds. It is highly unlikely that 17% (69 of 252) of balanced funds changed their investment mandates twice in the span of six years. It is also unlikely that 17% of balanced funds actually became materially more or less risky in a span of six years. The concern bubbles over to equity funds as well, which understandably exhibit more volatility, but having the majority of these funds change risk ratings frequently isn’t necessarily helpful to the investor.
How Should Investors Consider their Risk Levels?
Though the risk rating is flawed in many ways, it is still an objectively calculated measure, which in its own way is useful to some extent so long as investors understand the limits.
This said, there are other financial measures of risk that can be useful to use instead of the risk rating, one of which it stated right in the fund facts document:
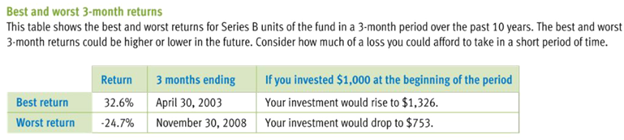
A measure of best/worst 3-month returns provides a much more relatable measure of how much risk is inherent in a fund. An investor might not know what a ‘medium’ risk level is, but they can relate easily to losing 24% of their assets in a span of three months. That said, like the risk measure, this 10-year lookback at best/worst returns now excludes the financial crisis.
Related to this but not stated in the fund facts document is a measure called maximum drawdown, which measures over a given time period how much a fund has lost in value from its peak to valley before a recovery period. This is useful because it removes the time constraint. A fund can continue to fall for more than 3 months at a time.
All this said, remember that if you own more than one mutual fund or ETF (which most investors do), the risk rating displayed on a fund facts sheet becomes less relevant, since what is important is the overall risk in your portfolio. That is, the performance (and risk) of your portfolio is not simply an ‘average’ of the individual risk levels of component funds. Rather, overall risk is calculated in consideration of the correlations between funds, which is not factored in when you look at individual fund risk ratings. Your advisors core responsibility when making investment recommendations is to ensure that a fund (in the context of your overall portfolio) is in line with your risk tolerance, and risk capacity.
Pro tip: Investors wishing to go further can check out measures like the Sortino and Treynor ratios, which are measures of return per unit of risk.
Questions to ask your Advisor:
- I understand you are recommending this fund to me. What are 2 comparable funds, and why did you recommend this one over the other two?
- How did this fund do during the financial crisis of 2008-2009?