Morningstar data finds that long-term trends and short-term volatility combined to make the Canadian Fixed Income Balanced category one of the biggest losers so far this year among Canadian-domiciled mutual funds.
Unlike equity or fixed-income funds, allocation funds are not restricted to just one asset class; they invest in both stocks and bonds, and generally benefit from the effects of diversification. The ratio of that mixture of stocks and bonds can vary significantly, and so the fund’s category can help investors understand and choose the right funds for them. If you are looking for a more aggressive strategy, for example, you would look in a different category than if your risk appetite and risk tolerance were more conservative.
Mutual funds or exchange traded funds in the Canadian Fixed-Income Balanced category can hold anywhere from 5% to 40% of their portfolio in equity and the rest in fixed-income. These funds would also need at least 70% of their securities – both bonds and equity – to be Canadian assets.
Unfortunately, 2022 so far has presented a rare case where both equities and bonds dropped significantly. The diversification benefits for allocation funds disappeared this year and with all this uncertainty, investors sought to cash out which resulted in many categories seeing outflows.
To compound the problem, since the start of 2017 to the end of August 2022 among Canadian-domiciled funds, allocation strategies with greater exposure to Canadian securities experienced long-term outflows while those with a global tilt saw heavy inflows.
Canadian investors looked abroad contributing to a net $80 billion in outflows over the period and invested more into US-styled and overall global strategies to the tune of $300 billon, potentially a case of investors chasing higher returns – the TSX returns over the period pale in comparison to the S&P 500. Over that period, the TSX Composite returned 7.38% vs. 12.11% for the S&P 500. The Morningstar US Market index returned a net 11.01% vs. 6.49% for the Morningstar Canada Index.
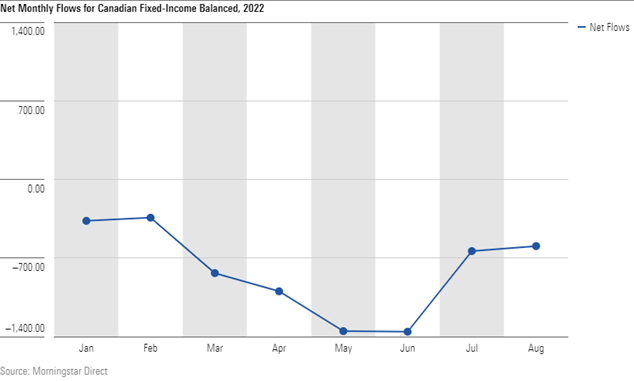
It’s Been a Bad Year for Canadian Fixed Income Balanced Funds
This all resulted in a Canadian Fixed-Income Balanced funds having a bad year. At $6.5 billion, the category saw the most outflows this year. Much of these outflows are attributable to increasing interest rates and a volatile and recoiling market.
The various shocks in late-February – oil price fluctuation, the Russia-Ukraine conflict – could explain the subsequent accelerated redemptions seen over the 4-month period from March to the end of June. That period represents 70% of the overall outflows, or $4.5B, year-to-date to the end of August. As global markets recovered and investors generally eased, this trend noticeably decelerated in July and August, though outflows are still elevated from the beginning of the year.
Which of these Funds Saw the Most Outflows?
86% of all Canadian fixed income balanced funds overall saw outflows year-to-date. The two largest funds in the space, the RBC Select Very Conservative fund, whose F-series earns a Morningstar Quantitative Rating of Silver, and the Bronze-rated TD Managed Income Portfolio account for 41% of the net outflows.
Only 12 of the 86 funds experienced net inflows for the year. A combined $300 million went to CIBC Balanced Index, whose F series earns a Bronze rating, and the neutral-rated Canoe Enhanced Income. These two funds represent over half of the gross inflows in the category.
What Should You Do Right Now?
Back near the end of March 2020, Morningstar wrote about the pitfalls of trying to time the market. My colleague Paul Kaplan found that practicing patience and holding one’s nerve ultimately can, in the end, reward investors who hold through difficult times.
“The latter set of returns is usually small in number. To see how many exactly, I sorted the monthly returns on the S&P/TSX Composite index from highest to lowest and removed them one at a time until the cumulative value on the remaining dips below 1. This turns out to be the highest 69 monthly returns which range from 16.5% (January 1975) to 5.8% (June 1977). This is 69 out of 773 months, or about 9% of the time. The returns necessary for success are somewhat rare, which goes to shows how important it is to stick with the market, no matter how painful,” he wrote.
For now, the decision to exit the Canadian Fixed-Income Balanced category looks like another case of short-sighted thinking; funds in the category, on average, were the best performers amongst the large allocation categories on a 6-month and 3-month basis, precisely the timeframe where outflows spiked. This is another reminder that allocation funds are designed to be long-term holdings and that timing the market, generally, proves to be a common mistake to make.