See more episodes of Quant Concepts here
Ian Tam: Welcome to Quant Concepts. In the Canadian stock investment landscape, high dividends can often be seen as a desirable characteristic to investors, often signaling the idea that a company will continue to return value to its shareholders in perpetuity. However, investors must also be cognizant of how sustainable dividends are in the future because unlike a bond, dividends are not guaranteed. One way to keep an eye out for this is to look at a company's dividend payout ratio. This ratio measures the percentage of the company's earnings or cash flows being paid out in the form of dividends. A company paying out too much of its earnings or too much of its cash flows is not likely to be able to sustain that dividend into the future, possibly resulting in a dividend cut. So, today, I'll use Morningstar CPMS to illustrate this concept.
So, if you take a look at my screen here, I'm going to run basically two examples; one using CPMS to build the model just looking at dividends and a second one that limits the payout ratio within certain numbers. So, the base case scenario is on my screen here. What I'm doing is taking all the stocks that CPMS covers in Canada, which is about 700 or so companies. I'm ranking those stocks strictly based on dividend yield. And I'm also going to run a screen to remove companies that are maybe a bit too illiquid for me to own. Specifically, today, I'm using a limitation of about 780 million Canadian dollars. That's meant to exclude the bottom two-thirds of market float in Canada. I'm considering stocks ranked in terms of the top 25% or top quartile. Anything not in the top 25%, I'm going to sell that stock. Again, really, we're just running a single factor model today as our base case.
So, let's have a look at how this model would perform, really, if I were strictly to pick stocks based on their dividend yield. So, on the screen here, you'll see I'm running a back test. I'm starting with a million dollars cash back in April of 1998. I would have purchased whatever 20 stocks had the highest yield at that point in time using the information available both from that point in time. At the end of each month, if one of those stocks drops below the top quartile in terms of the rank, which again is based on dividend yield, I sell the stock, and I immediately replace it with the next highest-ranking stock. And in today's model, I'm using no more than four stocks per economic sector, just to make sure I'm somewhat diversified across the economy.
So, let's have a look at the back test results on the screen here. And off the bat, they don't look like bad results. You can see that the model really just picking the highest dividend yield stocks paid about 9% annualized. That's your total return over a fairly long period of time, which beats the TSX by roughly 2.4% and a turnover of about 16%, meaning that the stocks that we purchase basically remain the same over time.
If you look a little closer, I also want to show you that in down markets, the strategy beat the market about 55% of the time. So, that's our base case, and certainly not a bad base case to begin with. However, you also – again, based on the theme today, we want to take a look at what the dividend payout ratios are.
So, I've now created a second model, which is essentially the exact same model, but I've applied two limits. So, the first limit you can see on the screen here is, I need that payout ratio on earnings to be less than 70%. In addition to that, I also consider whether the payout ratio on cash flows is less than 50%. So, as long as one of those two conditions are met, the stock still qualifies for my screen. On the sell portion of my strategy, I'm going to sell stocks if their payout ratio on earnings exceeds 80% and their payout ratio on cash flows exceeds 60%. So, I'm using two different payout ratios here because in certain sectors, for example, REITs and utilities stocks tend to trade more on a cash flow basis, whereas all the other sectors tend to trade more on an earnings per share basis. So, I'm using both metrics to capture the full economy here.
So, with this modified model, I just want to run another back test to show you how this model with those payout limits applied would actually perform over time. So, using the same back test period, same parameters, 20 stocks, no more than four stocks per sector, let's see how this strategy does over that same amount of time.
Okay. So, in this second version of my model, you can see that the annualized total return is about 10.3%. That's about 130 bps on an annualized basis better than the previous model. You'll also notice that this beats the benchmark by about 3.7%. Today's benchmark is the S&P/TSX composite. The turnover is roughly double the original model, which kind of makes sense because we're selling stocks if their payout ratios exceed our limits stated in the model.
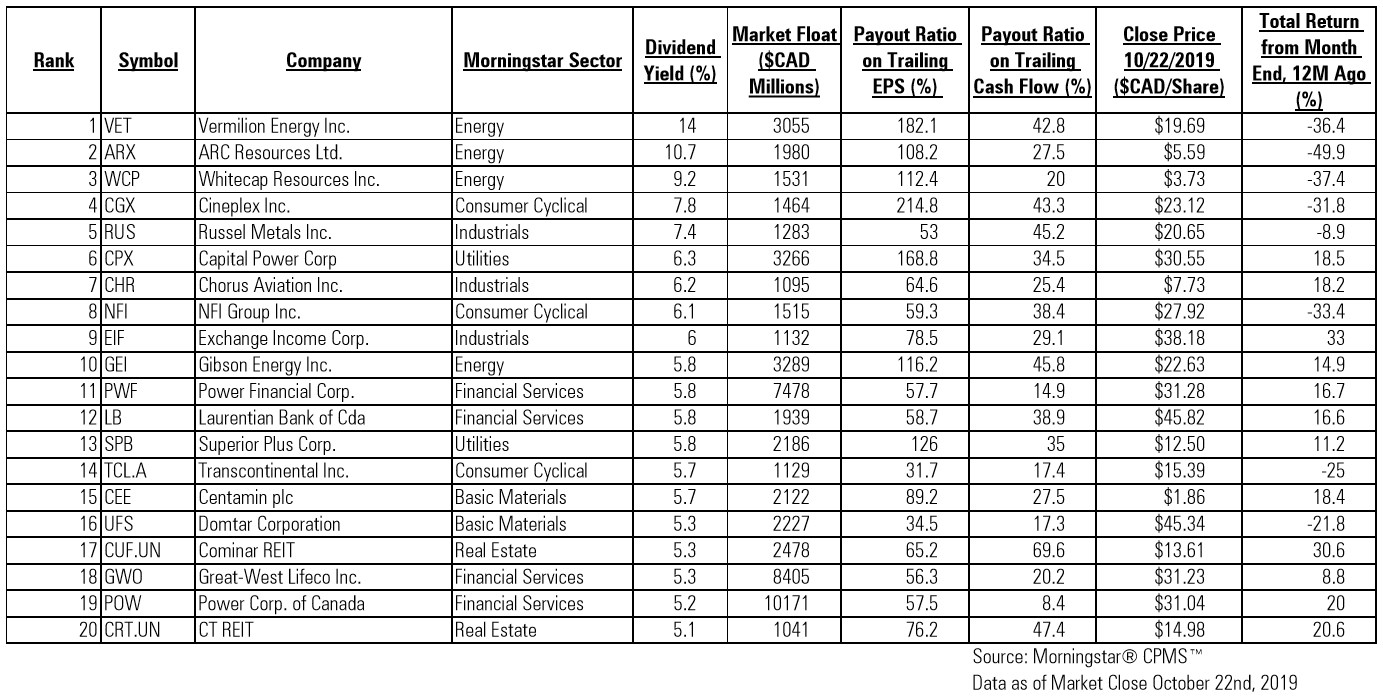
Looking a little closer, I also want to mention that in down markets, the strategy beats the index about 68% of the time, so a little bit more defensive in nature than the original model. So, even though the dividend yield on this portfolio is a bit lower than the original model, because we put in those limits, you can see that over time, keeping an eye on a payout ratio actually provides better returns and better results than had you not done that. So, the stocks that qualified to be purchased today into the payout limited model will appear in the table accompanying the transcript to this video.
For Morningstar, I'm Ian Tam.