
Robinhood, the brokerage app in the U.S. geared toward smaller individual investors, has surged in popularity thanks to its free trades, zero account minimums, and streamlined user-friendly interface. According to a Robinhood spokesperson, the app currently has more than 13 million users with a median age of 31. Thanks in part to Robinhood’s growth, millions of smaller investors are now actively engaged in buying stocks for their own portfolios.
Robinhood’s mission is to democratize investing and make access to the financial markets “friendly, approachable, and understandable,” a laudable goal. But buying individual stocks is obviously more risky than investing through a broadly diversified mutual fund. More than four in 10 U.S.-based stocks have suffered drops of 50% or more over a three-month period, compared with just 2% of all U.S.-based equity mutual funds. It’s also crucial to get a handle on the overall characteristics of all of the stocks (and other investments) you own. Understanding their individual traits can help shed light on how they’re likely to perform in different market environments.
In this article, I’ll apply Morningstar’s Global Risk Model to analyze the underlying risk exposure of some of Robinhood’s most widely held stocks. It's a pretty idiosyncratic list. As a whole, they’re fairly volatile and sport high trading volumes despite often-tiny market caps, but also often lack economic moats and have weaker balance sheets.
The Robinhood Portfolio
Robinhood publishes a list of “100 Most Popular Stocks,” updated daily. Robinhood doesn’t disclose details about the relative popularity of each stock, so we don’t know how many stocks a typical investor owns or in which proportions. Because Robinhood caters to smaller investors, most users probably don’t own shares in all 100 names on the list. With that limitation as a caveat, I put together a hypothetical portfolio with equal weightings allocated to each security on the list. For comparison purposes, I used the equally weighted version of the S&P 500, which is a fairly close match for Robinhood's list in terms of overall market cap and other portfolio statistics.
At a high level, the Robinhood list is mostly made up of stocks, with a handful of exchange-traded funds, including Vanguard Total Stock Market ETF (VTI), Vanguard S&P 500 ETF (VOO), ProShares Ultra Bloomberg Crude Oil (UCO), and Direxion Daily S&P Oil & Gas Exploration & Production Bull 2X Shares (GUSH).
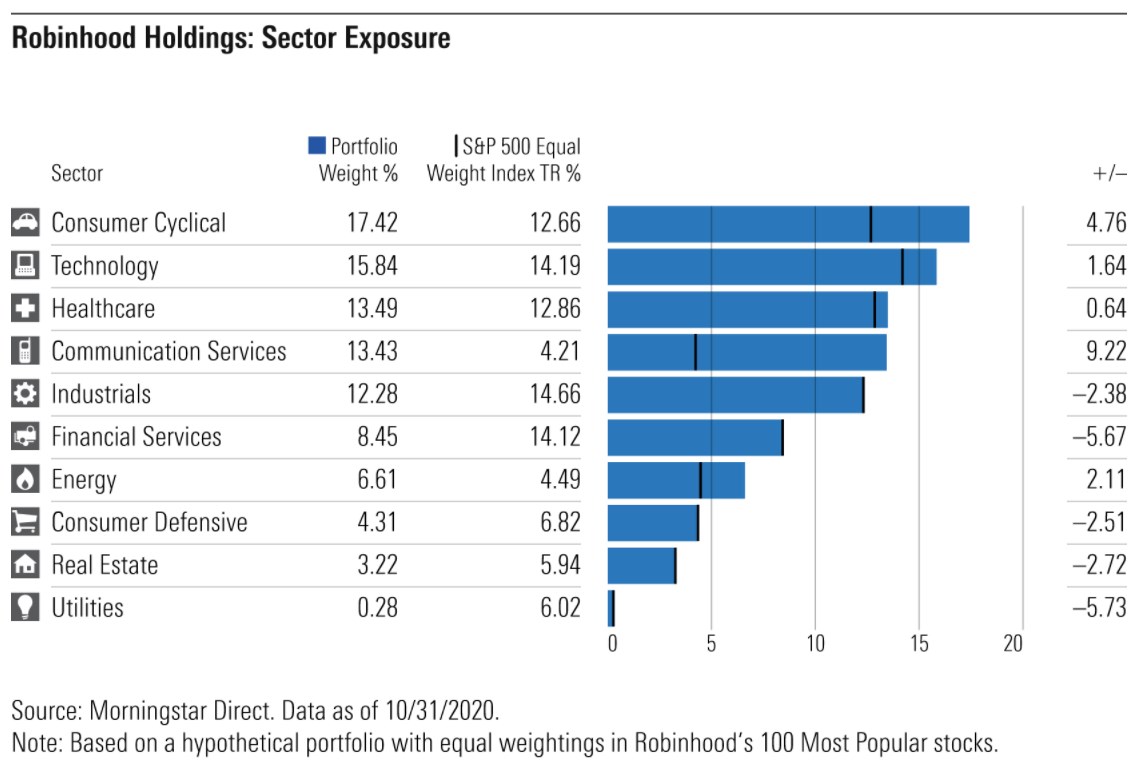
As shown in the chart below, the Robinhood list is heavy on communication services, consumer cyclicals, and energy stocks, and light in utilities, financials, and consumer defensive stocks. The technology weighting is roughly in line with the equally weighted version of the S&P 500 but significantly lower than the tech-dominated market-cap- weighted version. This sector profile gives it a fair amount of economic sensitivity, meaning that it would likely suffer in a prolonged economic downturn but could benefit from an economic recovery.
Next, let’s take a deep dive into the 11 style-based factors in our Global Risk Model.
How the Stocks Stack Up on 11 Different Factors
The Morningstar Global Risk Model, which we introduced in 2016, helps investors better understand their risk exposures to as many as 36 different factors broken down across style, sector, region, and currency. In this article, I’ll home in on the 11 style-based factors, which all help shed light on stock-price performance. Six of the 11 style factors (Valuation, Valuation Uncertainty, Economic Moat, Financial Health, Ownership Risk, and Ownership Popularity) are based on Morningstar’s fundamental equity research and extensive ownership data. The other five factors (Liquidity, Size, Value-Growth, Momentum, and Volatility) are traditional risk factors that have been widely studied by academic research.
One advantage of the Global Risk Model is that it can capture a portfolio’s risk both in aggregate and at the individual-stock level. To make these comparisons easier, we normalize the scores so that a score of zero can be interpreted as the average score among a group of about 7,000 stocks. We express each score in terms of the number of standard deviations from the average. (This measure is known as a z-score.) We also set the sign of each exposure so that positive numbers are generally associated with factors that have shown a positive effect on returns over time.
The chart below summarizes the risk factor exposures for the stocks as a group; a complete list of holdings is available here.
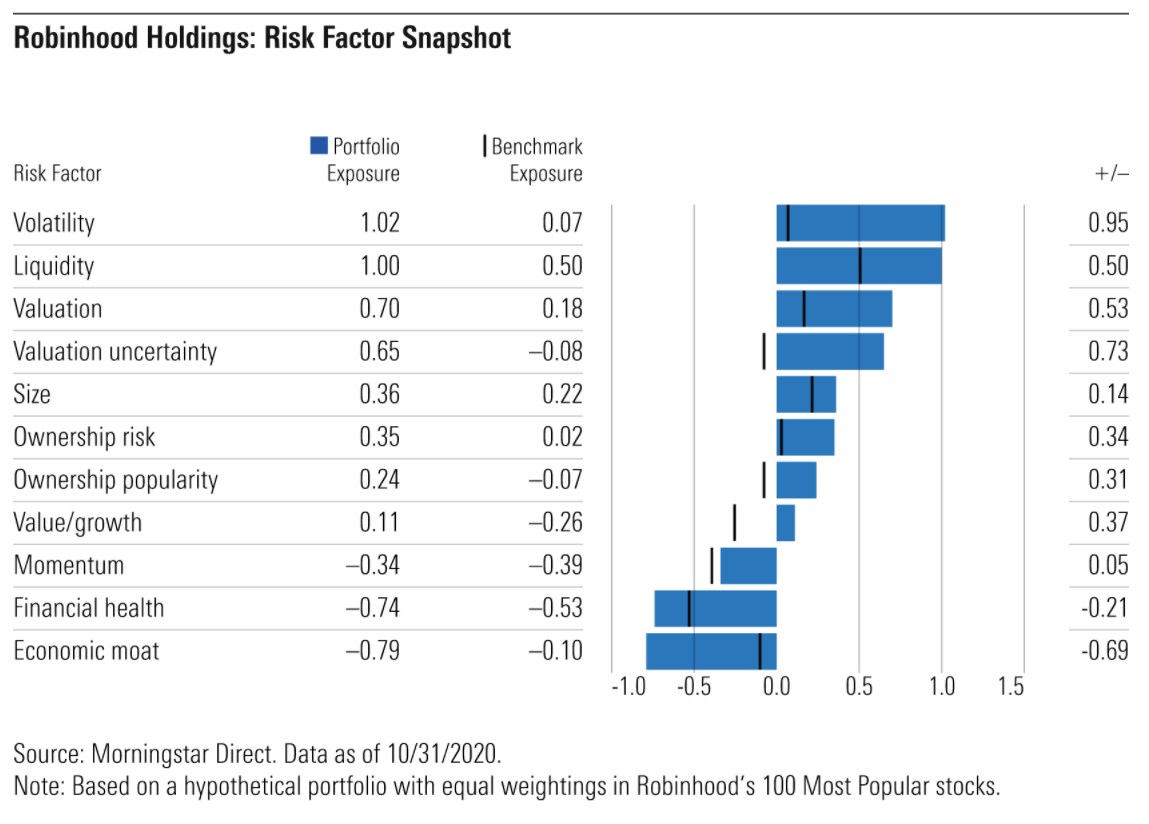
Volatility: Our Volatility factor is based on a stock’s range of historical prices over the past year. Based on our research, stocks with higher volatility scores have statistically outperformed over longer time periods, but also have a wider range of expected outcomes. On average, the stocks included in the Robinhood portfolio scored well above average for volatility, with a z-score of 1.02 compared with 0.07 for the equally weighted benchmark. Some of the most volatile stocks on the list are Fuel Cell Energy (FCEL), Tilray (TLRY), and Aurora Cannabis (ACB).
Liquidity: The Liquidity factor measures a stock’s average trading volume over the past month relative to total shares outstanding. It’s basically a measure of how quickly a stock’s ownership base changes hands between different investors. This factor has been widely studied by academic researchers, although there's no consensus about whether liquidity leads to higher or lower returns over time. Morningstar’s own research has found the liquidity premium is relatively small but tends to pay off most during recessionary periods. Overall, the Robinhood portfolio scores relatively high on liquidity, with a z-score of 1.00 versus 0.50 for the benchmark. While high trading volume is generally beneficial, it can also be subject to rapid changes. Robinhood favorites like Eastman Kodak (KODK) and Beyond Meat (BYND) may be popular at the moment, but trading volume can quickly dry up if they fall out favor.
Size: The Size factor is based on the market cap of the stocks included in a portfolio, with higher scores indicating more exposure to smaller-cap stocks. Academic research has found that smaller-cap stocks tend to outperform over longer periods even after adjusting for higher levels of market-related risk. Morningstar’s research has also found evidence of small-cap outperformance over longer periods, although larger-cap stocks have taken a strong lead over the past decade. With a portfolio z-score of 0.36, the Robinhood portfolio has far more exposure to small-cap stocks than the benchmark index. Moreover, about half of the small-cap Robinhood stocks land in riskier micro-cap territory.
Valuation Uncertainty: The Valuation Uncertainty factor is based on Morningstar’s Quantitative Uncertainty Rating and measures the level of uncertainty embedded in a company’s Quantitative Fair Value Estimate. Companies with less consistent operating earnings and capital spending tend to have less stable cash flows, making it more difficult to pin down an estimated fair value. Higher scores imply greater uncertainty with a wider range of potential valuation outcomes. By extension, portfolios with high scores for Valuation Uncertainty tend to have more volatility in returns. The top 100 Robinhood stocks have a portfolio z-score of 0.65 for Valuation Uncertainty, compared with negative 0.08 for the benchmark. Popular Robinhood holdings such as Aurora Cannabis and Virgin Galactic Holdings (SPCE) have some of the highest ratings for Valuation Uncertainty.
Valuation: The Valuation factor measures how cheap or expensive a stock is relative to Morningstar’s Quantitative Fair Value Estimate, which is based on a statistical model that calculates fair values based on a company’s projected future cash flows. Higher scores indicate the company is undervalued and more likely to generate positive future returns. Over time, we’ve found a strong connection between Valuation factor scores and future returns, with undervalued securities often generating stronger returns. The Robinhood portfolio scores well on this metric; it has a z-score of 0.70 compared with 0.18 for the benchmark. As mentioned above, though, the portfolio also gets a high score for Valuation Uncertainty, so take the high Valuation factor score with a grain of salt.
Ownership Risk: The Ownership Risk factor defines a stock’s risk level based on the company it keeps. We gauge Ownership Risk by looking at the risk profiles of the funds that own shares in the same security. If funds owning the stock tend to have high risk profiles, we assign a higher Ownership Risk score. The stocks in the Robinhood portfolio score about 0.34 standard deviations higher than the benchmark index for Ownership Risk. Some of the highest-scoring Robinhood stocks on this metric are iBio (IBIO) (owned by a number of extended-market index funds with higher risk scores), Energy Transfer LP (ET) (owned by several master limited partnership ETFs), and Inovio Pharmaceuticals (INO) (owned by many biotech ETFs). Stocks with high Ownership Risk scores generally suffer deeper losses during market downturns.
Value-Growth: This factor measures value and growth characteristics based on how the market is pricing a stock. If the stock’s current price is high relative to a simple price estimate based on earnings yield, dividend yield, and book value, that suggests the stock has higher growth expectations baked into its current price. On the flip side, a low current price relative to the simple price estimate indicates a value leaning. Stocks with higher growth orientations receive higher Value-Growth scores. The stocks in the Robinhood portfolio score significantly higher than the benchmark on the Value-Growth factor. Robinhood favorites like Starbucks (SBUX), Tesla (TSLA), and Beyond Meat have pronounced growth orientations, although the list also includes more value-oriented names such as Berkshire Hathaway (BRK.B) and Exxon Mobil (XOM).
Ownership Popularity: The Ownership Popularity factor represents the growth in the popularity of a particular stock from the perspective of fund manager ownership. High Ownership Popularity indicate that more fund managers have been increasing their positions in the stock over the past several months. Not surprisingly, the most popular Robinhood stocks have above-average scores for Ownership Popularity, with a z-score of 0.24 compared with negative 0.07 for the equally weighted index. Some of the highest-scoring stocks for Ownership Popularity are FuelCell Energy, Virgin Galactic Holdings, and iBio. However, Robinhood investors also own shares in several out-of-favor names, such as Norwegian Cruise Line Holding (NCLH) and United Airlines Holdings (UAL).
Momentum: The Momentum factor measures how much a stock risen in price over the past year relative to other stocks. Academic research has consistently found that stocks that have performed well in the short term generally continue to perform well even after accounting for other factors that tend to drive returns. Morningstar’s research has also found that Momentum tends to be a significant factor in stock-price performance, although momentum-oriented stocks also tend to suffer more during market drawdowns. Surprisingly, the stocks on the Robinhood list aren't significantly more momentum-oriented than average, with a z-score of negative 0.34, compared with negative 0.39 for the benchmark. As mentioned above, the Robinhood list includes a number of stocks that have been out of favor, such as airlines, cruise lines, and energy-related holdings.
Economic Moat: The Economic Moat factor is based on the Morningstar Quantitative Economic Moat Rating, which is designed to measure the strength of a firm’s competitive advantage by evaluating the sustainability of its profits. Higher scores suggest a firm will be able to keep competitors at bay for an extended period. Morningstar’s research has found that companies with wide economic moats tend to hold up better during periods of economic weakness, although companies with narrower moats often fare better when the economy recovers. The stocks on the Robinhood list score well below average on this factor, with a z-score of negative 0.79, compared with negative 0.1 for the index. The list includes some wide-moat stalwarts, such as Starbucks, Coca-Cola (KO), and Johnson & Johnson (JNJ), but is more heavily weighted toward firms that don’t score well on the Economic Moat factor, such as Norwegian Cruise Lines, Spirit Airlines (SAVE), and Carnival (CCL).
Financial Health: The Financial Health factor is based on strength of a firm’s financial position and ranks companies based on how likely they are to fall into financial distress. Higher scores imply stronger financial health and therefore a lower risk of bankruptcy. Stocks that score well based on this factor tend to hold up better during economic downturns, such as the global financial crisis in 2008. Stocks included on the Robinhood list score below average on Financial Health, with an average z-score of negative 0.74, compared with negative 0.53 for the benchmark. The Robinhood list includes financially sound stalwarts such as Fitbit (FIT) and JPMorgan Chase (JPM) but is more heavily weighted toward troubled firms such as American Airlines (AAL) and Dave & Buster’s Entertainment (PLAY).
Conclusion
As a group, the most popular stocks on Robinhood score higher on nearly every dimension of risk captured by our Global Risk Model, with the possible exception of momentum and liquidity. Some of their common traits--such as a smaller-cap orientation, heavy exposure to economically sensitive sectors, and a contrarian bent--could pay off if there’s a strong economic recovery. But the stocks on the list also court a fair amount of risk. They’re vulnerable to downturns both in the overall economy as well as company- and stock-specific factors. Most beginning investors would probably be better off investing in a broadly diversified fund. If you decide to venture into individual stocks, make sure to check under the hood before clicking the buy button.
The author has an ownership position in the following securities mentioned in this article: BRK.B, JNJ, SBUX, XOM.


:quality(80)/cloudfront-us-east-1.images.arcpublishing.com/morningstar/J23NAJUY3ZA6DL4H7A3HEVXXGU.jpg)