


The yield on 10-year Canadian bonds continue to fall well below the dividends paid by TSX stocks - a fact that may push some income-oriented investors toward dividend paying stocks. As we noted in an article we wrote last year, this approach is not for everyone. But those who believe that dividend payers offer some benefit in an ultra-low interest rate environment Could consider some ideas from today’s model.
Exhibit 1: 10Y Canadian Government Bond Yield vs. S&P/TSX Composite Dividend Yield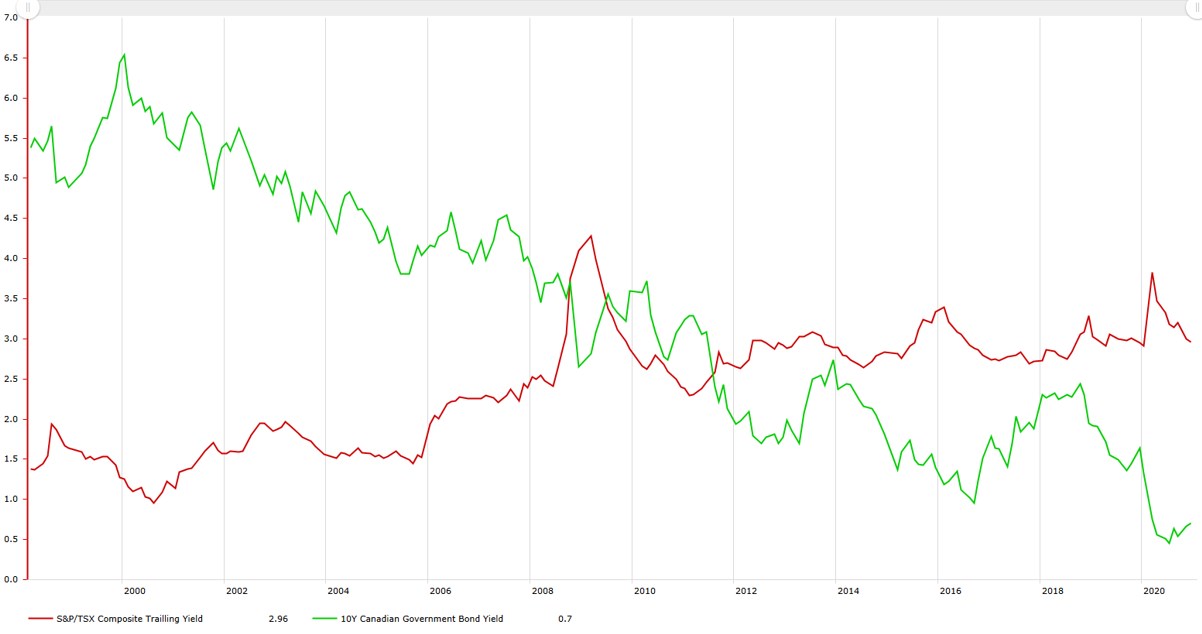
Source: Morningstar CPMS
To find a set of sturdy dividend payers, we used Morningstar CPMS to first rank all the stocks in the S&P/TSX Composite Index on various factors and associated weights. The factors combine profitability, index sensitivity, dividend yield and dividend growth metrics to rank the stocks. Stocks were also screened to ensure reasonable dividend payout ratios. The stocks that met the requirements today are listed in the table. But first, here are the factors we used:
- Yield on Expected dividends - calculated based on announced dividends that the company has yet to pay.
- 5-year Normalized Dividend Growth Rate – which measures how much dividends have grown on average each year over the last five years
- 5-year Cashflow Growth Rate – which measures growth of operating cash flow
- 5-year Average Return on Equity – this measures the net income (after paying out expenses) of a company against its book value of equity
- 5-year Standard Deviation of ROE – a statistical figure measuring consistency
- 5-year Price Beta – a measure of sensitivity against an index. A stock showing a beta of 1 has historically moved in tandem to the index over a 5-year trailing period. A stock with a beta of less than one has moved less than the index. Here, we used beta as defensive metric, preferring companies with low betas.
To ensure that this strategy worked reasonably over time in the Canadian market, I used Morningstar CPMS to conduct a back test. Back testing involves applying the same set of criteria and rules consistently over time using historical data, then measuring the theoretical performance results. I tested these rules using a starting portfolio of 15 stocks, with a limit of 4 stocks per economic sector to ensure reasonable diversification using a start date of September 1997 and an end date of December 2020. Once a month, the portfolio was checked to see if any of the stocks broke the sell criteria. If they did, they were replaced with the next highest-ranking stock not already held in the portfolio. This model showed an annualized return of 11.1% between September 1997 and December 2020, while the S&P/TSX Composite TR index produced 6.6% on the same basis. Though no backtest is bulletproof, it certainly gives us a hint that choosing stocks in this manner shows reasonable results historically.
The stocks that meet the data today are as follows:
| Company | Dividend Yield | 5-yr ROE Deviation | 5-yr Cashflow Growth | 5-yr ROE | 5-yr Div Growth | 5-yr Beta | Expected Div Growth | Economic Moat Rating |
| Great-West Lifeco Inc. | 5.7 | 0.5 | 7.9 | 13.9 | 6.1 | 0.8 | 1.4 | No Moat |
| BCE Inc. | 6.1 | 2.3 | 4.3 | 20.5 | 5.1 | 0.3 | 1.2 | Narrow Moat |
| TC Energy Corporation | 5.9 | 1.2 | 5.6 | 13.7 | 9.7 | 0.8 | 1.9 | Narrow Moat |
| Cdn Utilities Ltd., A | 5.6 | 0.9 | 2.3 | 12.2 | 8.8 | 0.6 | 0.8 | Not Rated |
| Emera Inc. | 4.9 | 1.2 | 8.1 | 9.3 | 7.5 | 0.2 | 4.1 | Narrow Moat |
| Brookfield Inf Partner | 3.8 | 1.4 | 34.8 | 2.8 | 9.6 | 0.9 | 1.8 | Not Rated |
| Capital Power Corp | 5.7 | 0.7 | 10.3 | 5.5 | 7.1 | 0.8 | 5.0 | Not Rated |
| Toronto-Dominion Bank | 4.2 | 1.5 | 9.6 | 14.7 | 9.9 | 0.9 | 1.6 | Wide Moat |
| TELUS Corporation | 4.7 | 2.0 | 4.6 | 17.8 | 7.2 | 0.6 | 6.8 | Narrow Moat |
| Bank of Nova Scotia | 5.2 | 1.1 | 6.8 | 14.4 | 6.3 | 0.9 | 0.0 | Narrow Moat |
| Royal Bank of Canada | 4.0 | 1.0 | 8.7 | 17.1 | 7.5 | 0.8 | 0.7 | Wide Moat |
| North West Company Inc. | 4.4 | 2.7 | 13.3 | 22.1 | 2.0 | 0.4 | 6.7 | Not Rated |
| CT REIT | 5.2 | 0.3 | 4.1 | 7.5 | 3.6 | 1.0 | 2.3 | Not Rated |
| Cogeco Communications | 2.6 | 1.7 | 5.7 | 17.0 | 10.7 | 0.5 | 10.3 | Not Rated |
| Transcontinental Inc. | 4.2 | 2.4 | 5.7 | 16.5 | 6.1 | 1.1 | 0.6 | Not Rated |
| Shaw Communications, B | 5.3 | 1.3 | 2.2 | 11.6 | 0.1 | 0.4 | 0.0 | Narrow Moat |
| Aecon Group Inc. | 3.6 | 1.7 | 7.8 | 6.5 | 9.0 | 1.0 | 2.4 | Not Rated |
| Killam Apartment REIT | 3.9 | 0.6 | 7.2 | 6.6 | 2.6 | 0.8 | 1.2 | Not Rated |
All numbers are in percentages.
Source: Morningstar CPMS Data as of Jan 14, 2021
This article does not constitute financial advice. It is always recommended to speak to a registered investment advisor or professional before investing.
Are You Getting The Right Returns?
Get Our Free Equity Indexes to Benchmark Your Portfolio Here


.jpg)


